It has been a long time since so many education issues have been so politically divisive, with sharp debates between conservatives and liberals, Republicans and Democrats about mask mandates, student sexual identity, and the role of race in the curriculum overtaking the routine work of educating students.
But as school districts have decided how to spend billions in federal Covid-relief aid, there has been more convergence on priorities—and even a few surprises, according to a FutureEd analysis of 5,000 school districts and charter organizations’ plans for spending some $75 billion in federal aid, a sample compiled by the data-services firm Burbio and representing three-quarters of the nation’s public-school students from every state.
Nearly the same percentage of local education agencies in red and blue states have earmarked Elementary and Secondary School Emergency Relief funds (ESSER III) for social-emotional learning, a hot-button issue for many conservative politicians. And both have made hiring and rewarding teachers their top priority and plan to spend at similar rates on tutoring, teacher training and new school infrastructure.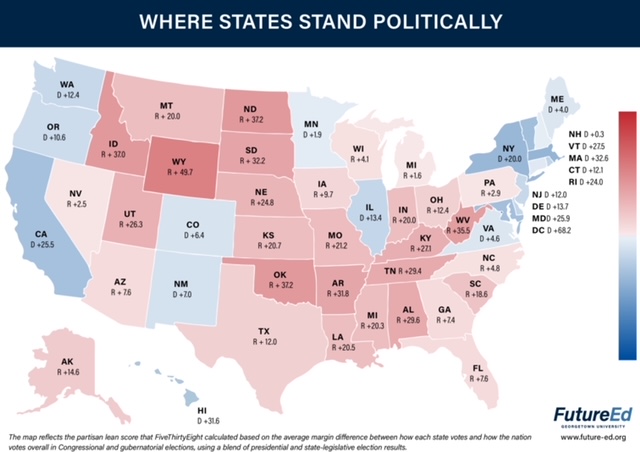
What’s more, red states are actually more likely than blue states to earmark funds for teacher bonuses and student assessments—counterintuitive findings given many conservatives’ opposition to testing in recent years and their fraught relationship with the teaching profession.
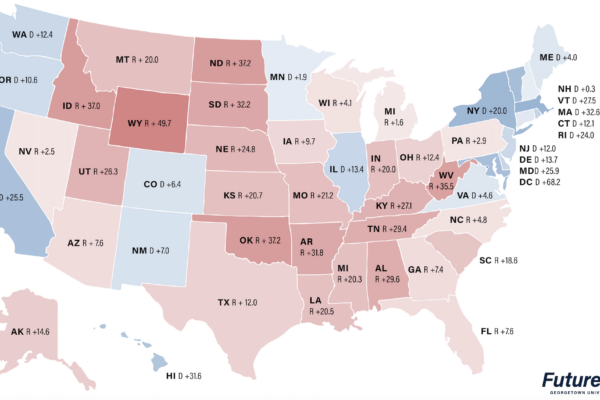
To identify red and blue states, we used FiveThirtyEight’s ranking of how states voted relative to the rest of the country in a mix of recent elections. The “partisan lean score” rates Wyoming as the reddest state, since GOP candidates scored nearly 50 points higher there than in the rest of the country. In deep blue Washington, D.C., Democrats outperformed the national average by 68 points. We put every state with the slightest tinge of pink into the red category, giving us 31 red states and 20 blue states. To test our results, we ran a second analysis, pulling out about 10 “purple” states in the center of the list where Republican or Democratic advantages were minimal, but there was little change in the trends.
Mental and Physical Health
Some of the most highly charged state and local 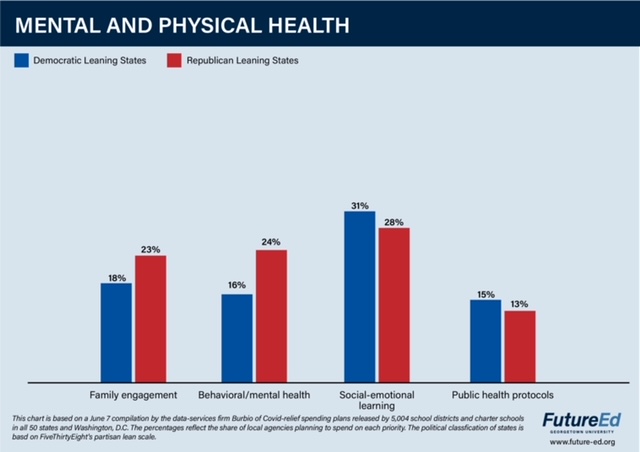 education debates since the onset of the pandemic have involved mask mandates, vaccinations and other health issues. But the controversy isn’t reflected in states’ local ESSER III spending plans.
About 15 percent of districts and charters in blue states report plans, for example, to invest in public-health protocols—including testing, contact tracing, and vaccines—compared to 13 percent in red states. Likewise, 31 percent of blue-state districts and charters include social-emotional learning (SEL) programs, materials, and training for staff members in their plans, compared to 28 percent in red states. The analysis shows that districts in red and blue states expect to spend about the same amount per student on this priority: $80 per pupil in blue state districts compared to $87 in red states.
The Salt Lake City school district in bright red Utah plans to spend more than $3 million of its $40 million allotment to introduce social-emotional learning and a behavioral support system. Fontana Unified School District in blue California plans to spend $7.8 million of its $96 million allotment on social-emotional learning curriculum and programming for students as well as training for staff members.
Some red-state districts may have reduced their commitments in these areas since they filed their plans last fall, as GOP leaders ramped up campaign to tie SEL to lessons on racial history they considered offensive. In Florida, for instance, the State Board of Education’s decision to ban the teaching of “critical race theory” prompted some districts to drop their SEL plans.
[Read More: How Local Educators Plan to Spend Billions if Federal Covid Aid]
Surprisingly, about a quarter of districts in red states have pledged Covid-relief funds for behavioral and mental health services and for family engagement, higher than the rates in blue states. In contrast, local education agencies in blue states have made larger commitments to bringing psychologists and social workers into schools (41 percent of agencies compared to 31 percent in red states). Syracuse City School District in New York, for instance, is devoting nearly $13 million of its $108 million allotment to expand its Student Support Services Department, which employs psychologists, counselors and social workers.
The spending on mental health professionals dovetails with what we found when we compared rural and urban districts. Rural schools often have less access to mental health professionals, and our analysis of the Burbio sample shows a higher proportion of rural districts in red states than blue states. The recent mass murders by 18-year-olds may spur local education leaders nationwide to increase their ESSER investments in behavior and mental health.
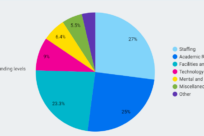
Staffing
Notwithstanding blue-state districts’ 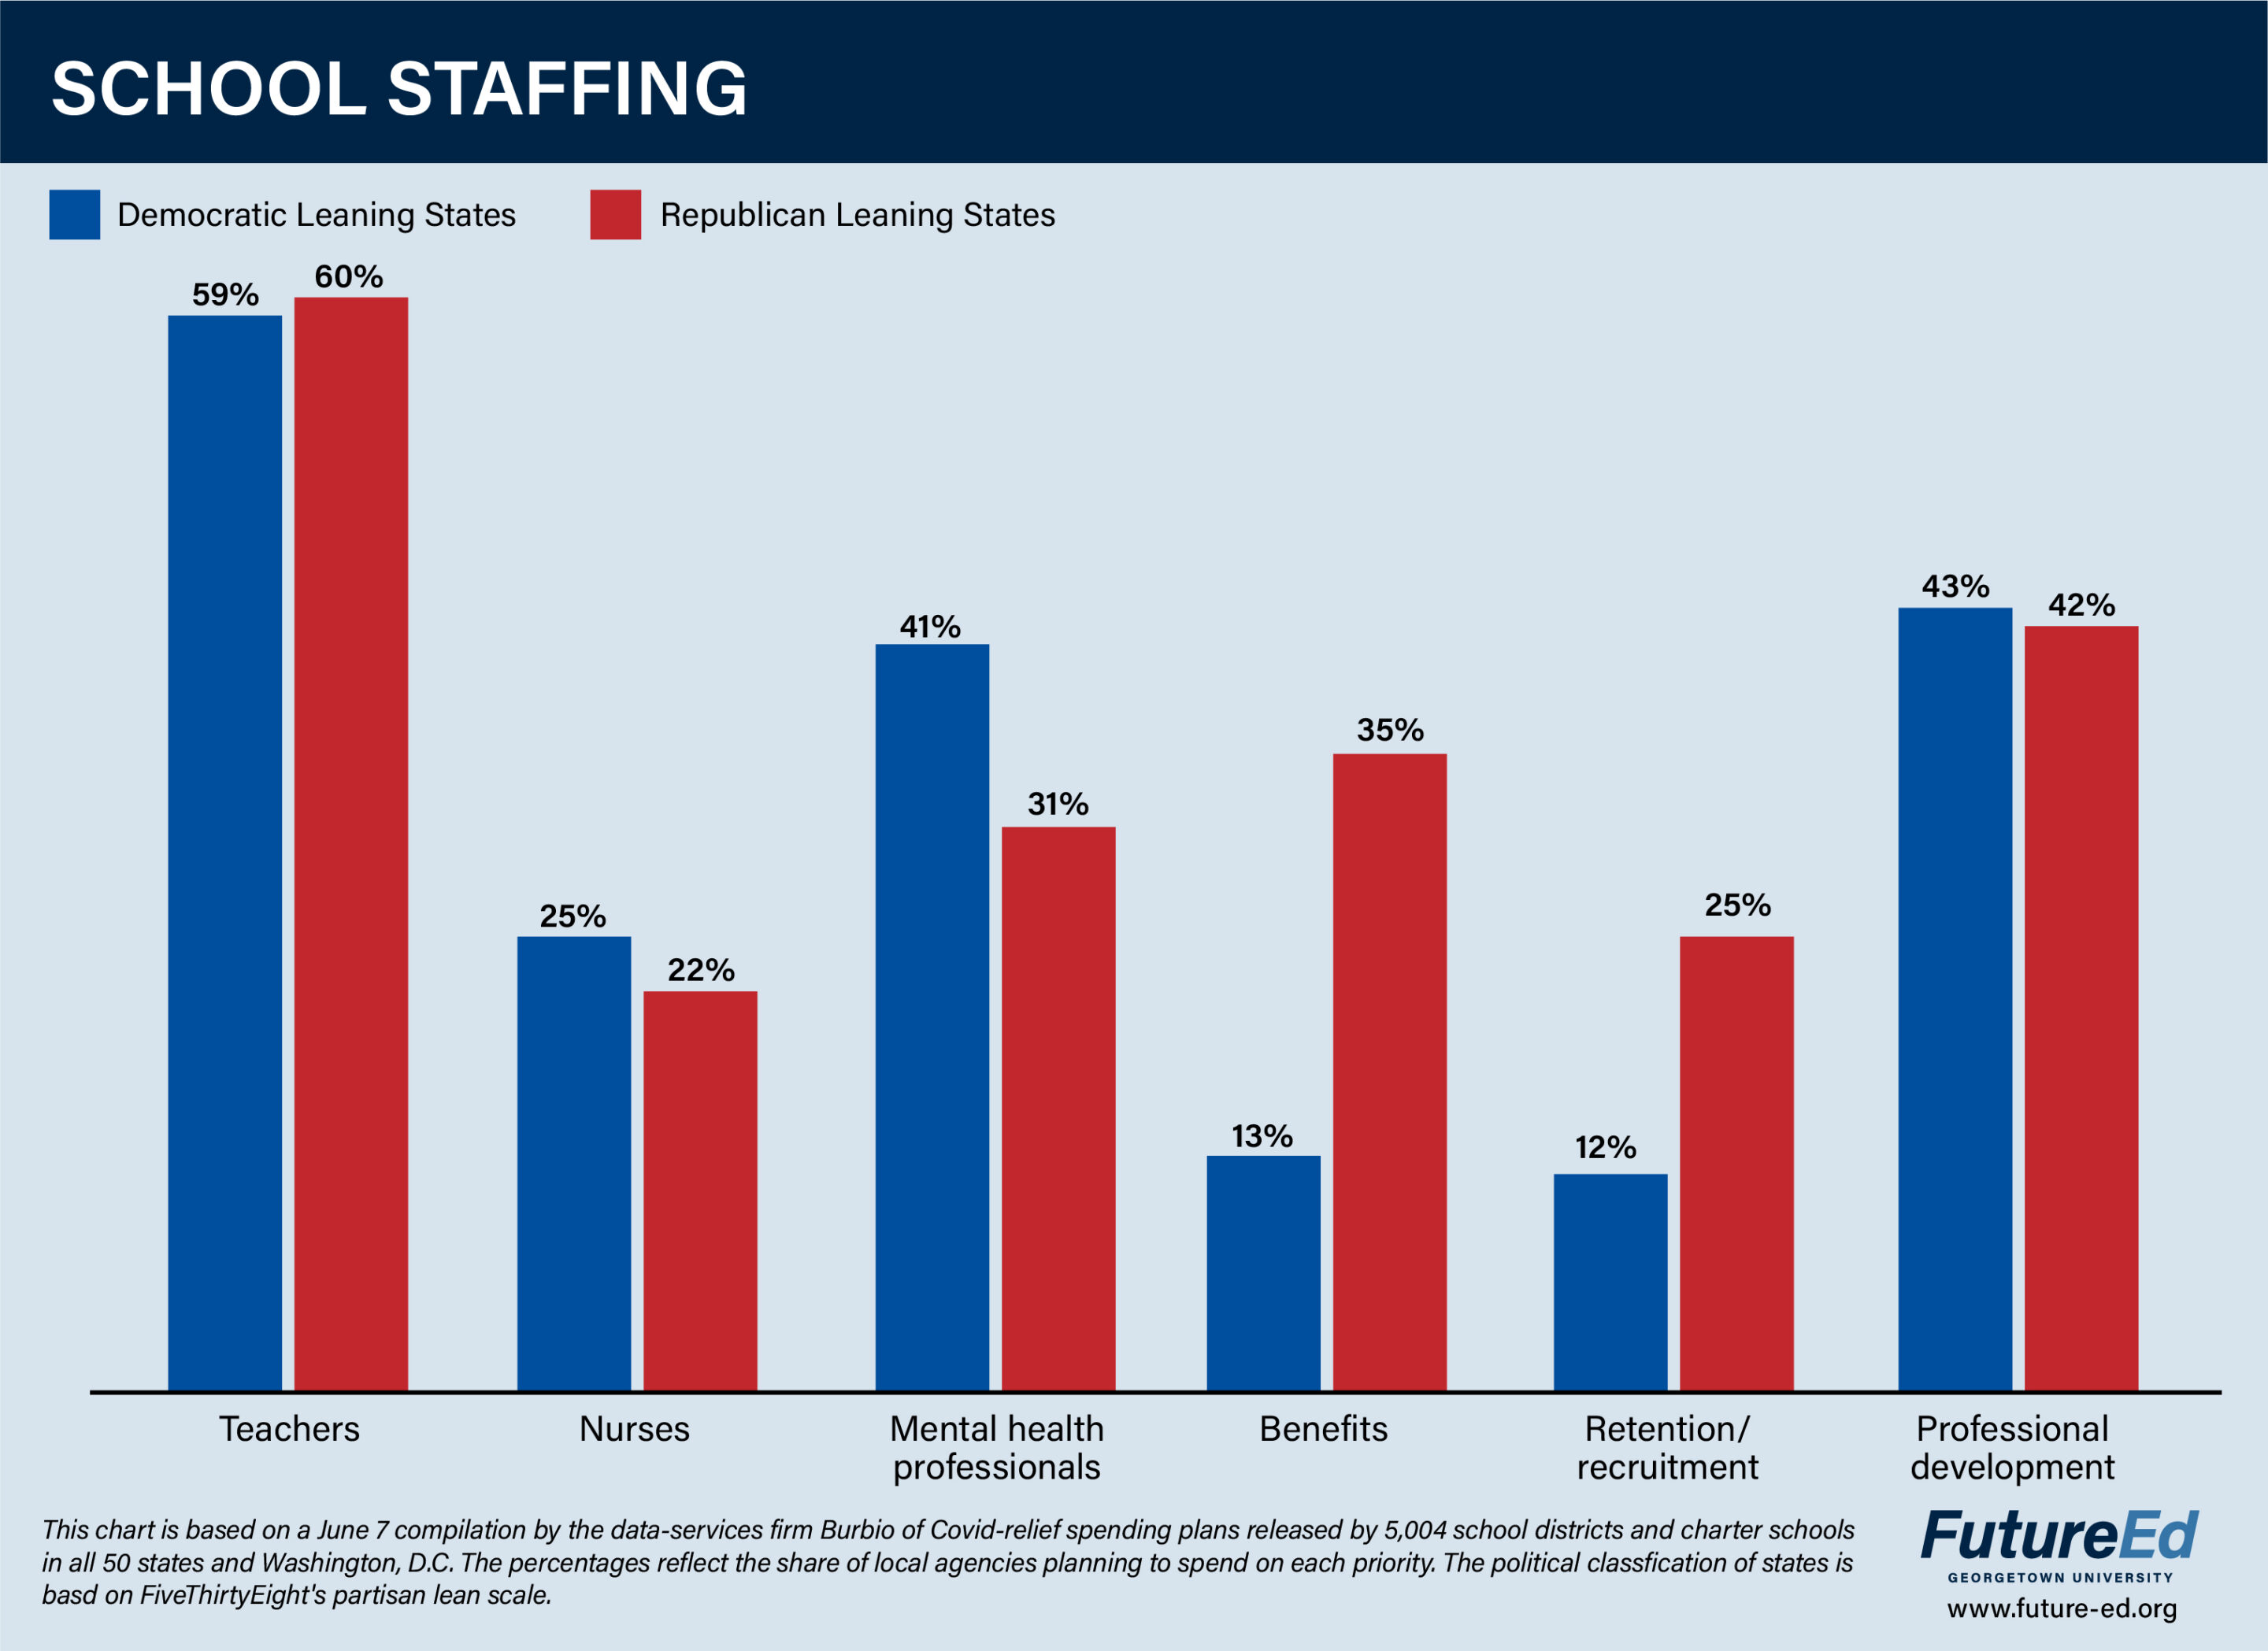 greater commitment to mental health professionals, staffing priorities are similar across the board. About 60 percent of districts in both sets of states are planning to spend a portion of their ESSER III funds on hiring or rewarding teachers, counselors or academic interventionists, making such spending the No. 1 priority in both groups of states. And more than 40 percent of districts in both red and blue states plan to invest in professional development opportunities for teachers and staff members. Districts in red and blue states also plan to spend on nurses and physical health specialists at relatively even rates.
Where they diverge is on staff retention and benefits. Red state districts and charters plan to fund employee benefits and assistance programs at a rate nearly three times that of districts in blue states (35 percent compared to 13 percent), the largest difference of any category we analyze. This may reflect acute staff shortages in more-rural red states, or the fact that some states ask districts to break out benefit costs in their ESSER III spending plans, while others lump benefits with salaries. Districts in red states are also more than twice as likely to project ESSER III spending for recruitment and retention efforts compared to districts in blue states (25 percent versus 12 percent).
Wayne County Public Schools in North Carolina, for example, plans to spend $8.5 million of its $55 million ESSER III allotment on teacher retention efforts that will allow the district to maintain small class sizes. In addition to hiring teachers and assistant principals to maintain staffing levels, the district also plans to award bonuses to teachers who sign or resign with the district.
Per-pupil spending in these categories varies only moderately, with blue state districts devoting an average of $201 per pupil to employee benefits, compared to $238 in red state districts. For teacher retention compensation, districts in blue states are planning to spend $336 per pupil versus $362 per pupil in red states.
Academic Recovery
The biggest differences in red- and blue-state 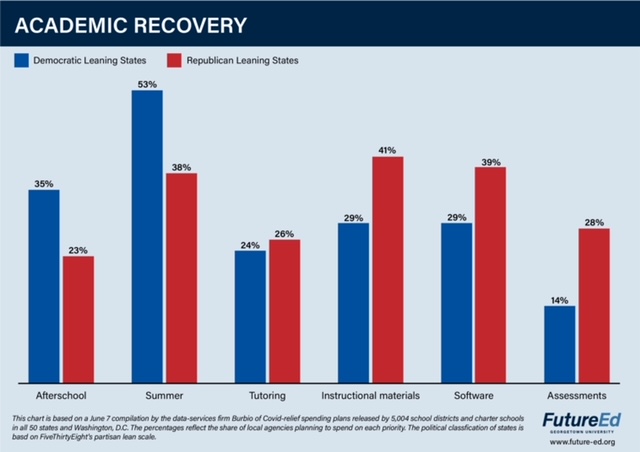 spending priorities involve academic recovery, although the choices don’t seem to be based in politics. American Rescue Plan aid comes with a requirement that K-12 schools spend at least 20 percent of the federal money on evidence-based strategies to address learning loss and boost academic achievement. Local education agencies in blue states are much more likely to pursue afterschool and summer learning as their primary strategies, while districts in red states are more likely to invest in curriculum, instructional materials and assessments.
More than half of districts in blue states intend to spend on summer learning programs, making it their top learning-loss strategy and their No. 3 priority overall. By contrast, 38 percent of districts in red states plan to spend on summer learning, and it ranks No. 6 on their list of priorities. Spending on afterschool programs is also more common in blue states than their more conservative counterparts.
[Read More: Financial Trends in Local Schools’ Covid-Aid Spending]
Districts in a handful of states report summer learning and afterschool as a single category, skewing these results somewhat. But even when we combine all planned summer and afterschool spending, blue states are still more likely to embrace extended-time interventions. Lowell Public Schools in Massachusetts plans to spend $1.7 million of its $40 million ESSER allotment expanding afterschool programs and $1.3 million on summer learning for all 27 schools in the district, allowing every student to receive extra support.
Roughly 40 percent of districts in red states plan to purchase instructional materials, software and curriculum. This compares to about 30 percent of blue-state districts. Tutoring has been equally popular in blue- and red-state districts, with about a quarter of districts in both red and blue states allocating funds. Districts in red states, though, plan to spend almost twice as much per student as districts in blue states ($167 vs. $89).
Facilities and Operations
Although a slightly larger percentage 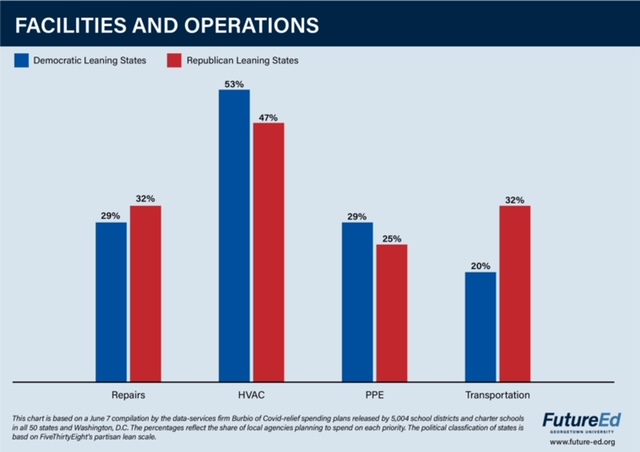 of districts in blue states plan to spend on HVAC systems—53 percent versus 47 percent—it is the No. 2 priority in both blue and red states, with very similar levels of investment on a per-pupil basis ($392 in red states, $398 in blue states). Similarly, nearly the same proportion of blue and red states have prioritized building repairs, which includes such things as lead abatement and bathroom upgrades, in their ESSER III spending plans—32 percent in red states versus 29 percent in blue states. Transportation is a bigger priority among localities in red states with a third of the districts planning to invest, compared to a fifth of blue state districts. This may also reflect the rural nature of many red state districts.
There are many factors that can influence how a local education agency decides to divvy up its allotment of federal Covid-relief funds, and just as many reasons for districts and charters to change their plans over the past year. But the key priorities–hiring and keeping good staff members, supporting students academically and emotionally, and upgrading facilities–remain remarkably consistent regardless of political persuasion.
FutureEd research associate Gunjan Maheshwari contributed to this analysis.