
The California School Dashboard, the state’s tool for rating schools and identifying those in need of support, was roundly criticized when it debuted in 2017. It was largely inscrutable, critics charged, and lacked sufficiently stringent consequences for underperforming schools. Surveys revealed that many Californians weren’t even aware of the dashboard, and that superintendents believed the information was insufficiently detailed and arrived too late in the school year to be useful.
In response, the California Department of Education spent the past year revising the dashboard and released a new version in December, in time to meet the federal Every Student Succeeds Act’s deadline for new state report cards on school performance.
The revised dashboard is better, but still has drawbacks. With one in eight of the nation’s public school students living in California, it’s worth knowing what has improved, and what hasn’t.
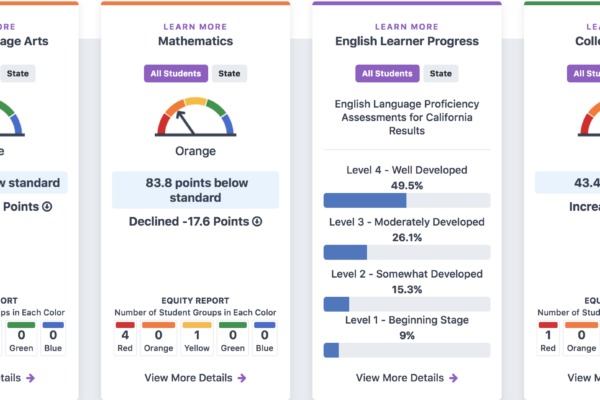
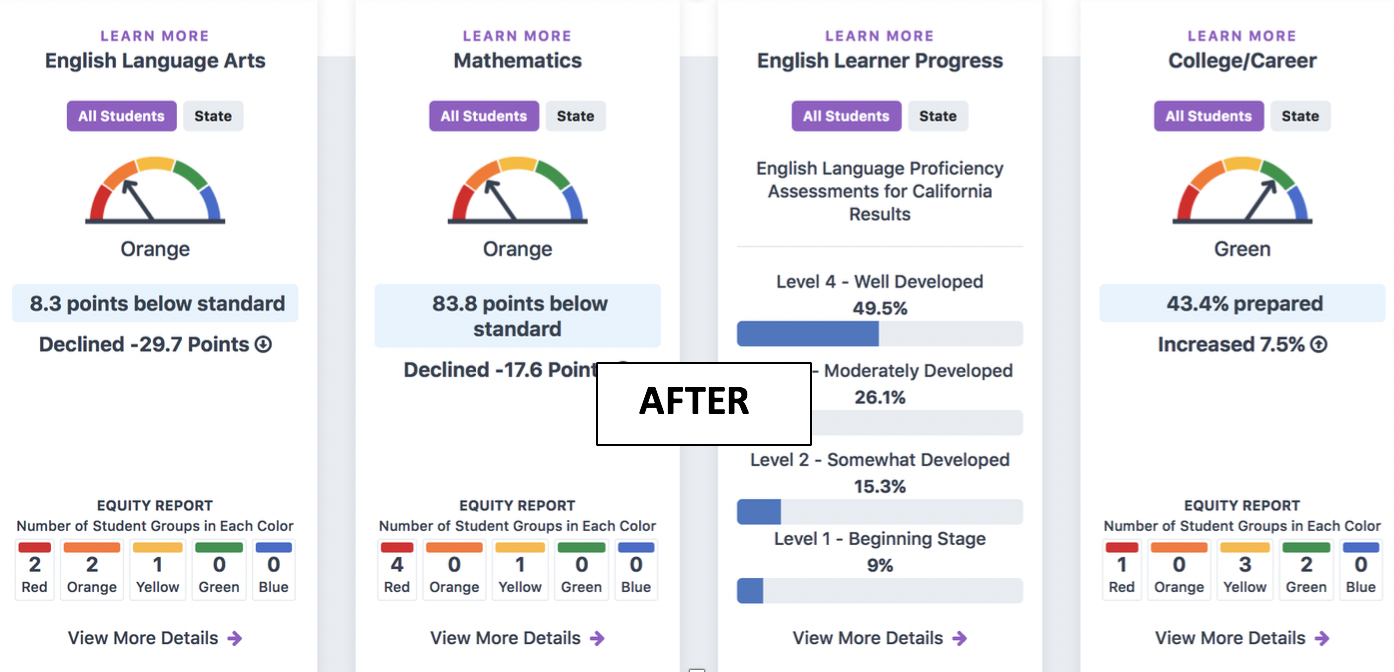
The Good: Visually, there is no question the new dashboard interface is an improvement. It is more attractive, more readable, and easier to navigate. The designers did a good job of making the ratings clearer, and they helped focus attention on the achievement of underserved students by reporting by race, socio-economic status and other categories the number of students performing at different academic levels.
The new dashboard is also much more comprehensive than its predecessor, with indicators for 11th grade achievement, chronic absenteeism, suspension rates, and college/career readiness. It is good to see that the dashboard now contains more non-test indicators than it did before.
The Bad: To my eye, the dashboard’s biggest weakness remains that it is not at all easy for a parent to compare schools. There’s no obvious comparison tool, so parents would have to go to each school’s report, record or print out information, and then compile and compare it on their own.
Many parents would probably also like an overall school score of some kind, or at least the ability to take the data available on the website and combine it into a clearer picture of school performance.
California’s old Academic Performance Index, which rated schools on a 200 to 1000 scale, was widely understood by parents. While many (including me) are somewhat ambivalent about aggregating diverse performance metrics into a single score, many parents would like this option. The state need not spell out the weights for combining measures if that’s not something it wants to do. It could simply give parents the ability to apply their own weights to construct school ratings.
[Read More: California Accountability: An ESSA Bellwether?]
The Dashboard still suffers from a poor choice of school “growth” measure. To calculate how much a school’s students improve academically over the school year, the state has inexplicably chosen to just subtract the previous year’s average scores from the current year’s. This approach is fatally flawed for many reasons, not the least of which is that many of the children will be different from year to year. The state could easily adopt a so-called value-added or student-growth-percentile measure, which uses individual students’ achievement data to tease out the causal effect of a school, and I hope they do so soon.
[Read More: Proficiency vs. Growth: Toward a Better Measure]
This first round of dashboard changes suggests that state officials have been responsive to the feedback they received. With a new governor and state superintendent, the state is well positioned to continue to improve the dashboard to make it more useful.
This process should start by clearly specifying what the dashboard’s array of data is intended to accomplish. Is it aimed at helping parents make decisions about schools? Or is it for school personnel to inform their improvement efforts? If the former, the tool needs more ability to compare and sort schools than it currently has. If the latter, it needs finer-grained data that arrives more rapidly. Even with the upgrades, it has a ways to go to have a meaningful impact on California school quality.