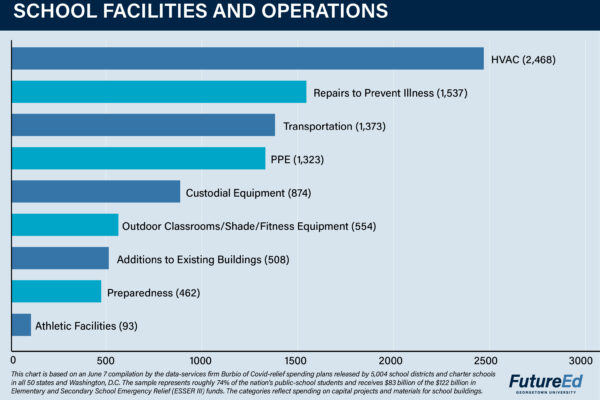
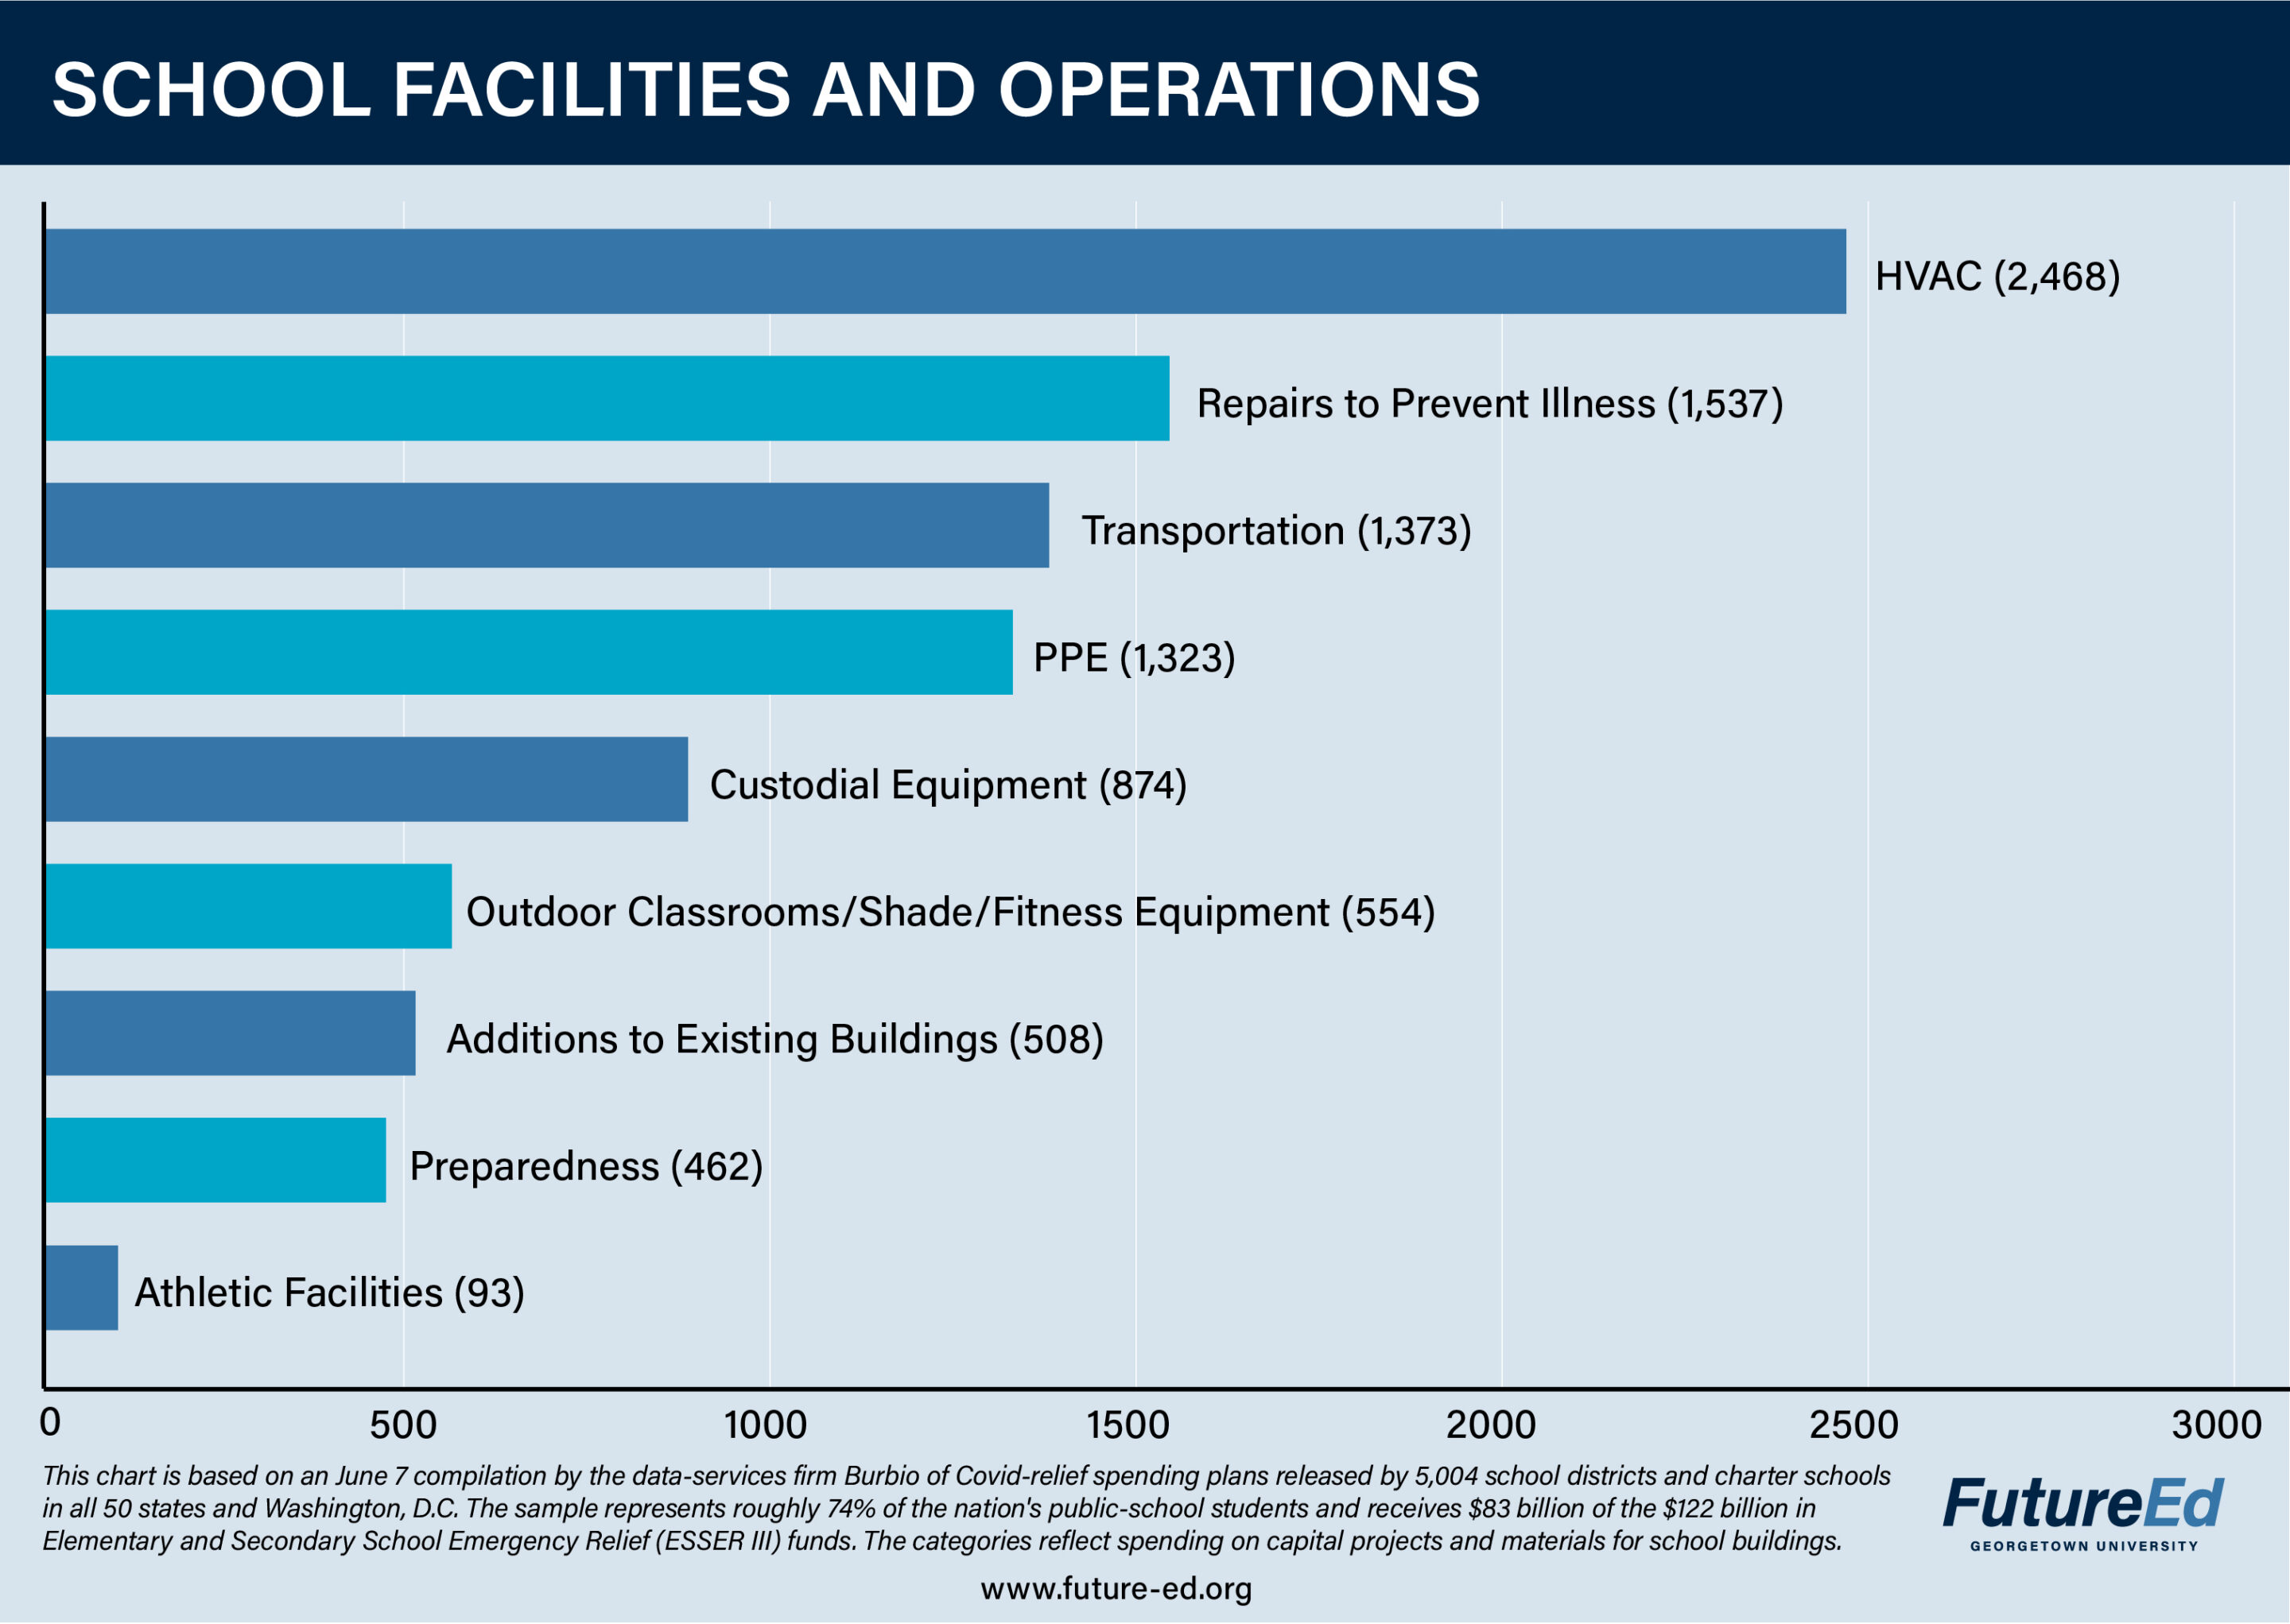
About half the school districts and charter schools included in the Burbio sample intend to spend on improving heating, ventilation and air conditioning systems. Such expenditures can range from buying better filters for existing units or replacing faulty systems that fail to heat or cool schools. Some are investing in repairs to prevent illness and new construction, while others plan to spend on personal protective equipment and the apparatus for outdoor classrooms.
View our regional analysis of spending plans
View our analysis of rural, urban and suburban spending plans
Read about research and best practices for:
More Resources:
- The Ventilation Problem in Schools
- GAO: School Districts Frequently Identified Multiple Building Systems Needing Updates or Replacement
- Education Department: Covid-19 Handbook
- Education Department: Use of Funds FAQ for School Construction
- Education Department: Use of Funds for Student Transportation
- Education Department: Staying in School in Person Guide