
For decades, the federal Free and Reduced-Price Lunch (FRL) program run by the U.S. Department of Agriculture has been used as a proxy to identify economically disadvantaged students. Participation in that program has been limited to students from low-income families, defined as those earning below 185 percent of the federal poverty line. FRL has been widely used in state school funding formulas and accountability systems to identify at-risk children.
But in 2010 Congress enacted two changes that made more students eligible for the program’s benefits, but reduced the quality of FRL participation as a proxy for poverty.
The first, known as Direct Certification, allows students who receive other forms of public support such as food stamps to be eligible for FRL. The second change, known as Community Eligibility, allows schools with at least 40 percent of students identified as eligible for FRL through direct-certification-type means to provide free lunches to all their students.
These policy changes expanded students’ access to free meals at school and eliminated some of the stigma attached to the program. Today, about one in five schools nationwide offers free lunches to all their students under the Community Eligibility provision.
But by expanding eligibility to some students above the original threshold, the changes made FRL a less-precise poverty proxy. As a result, states are now working to determine what other measures can be used to identify at-risk students more precisely.
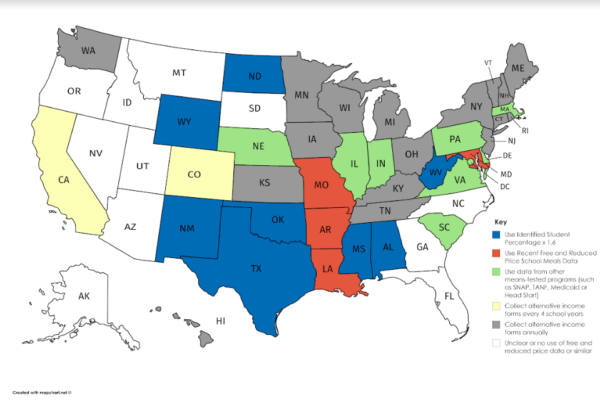
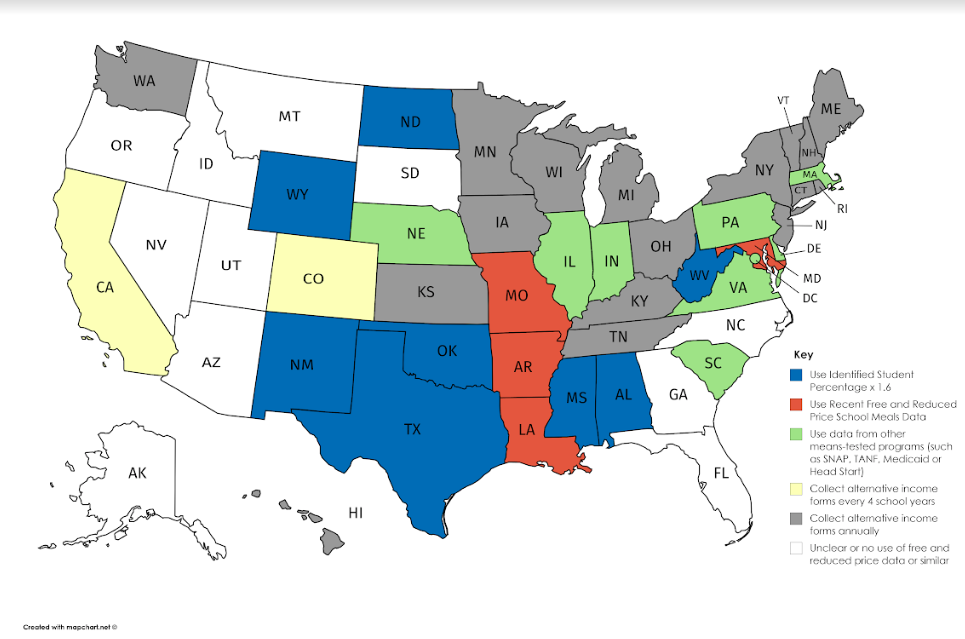
The map above, based on an analysis by the Food Research & Action Center, shows the five main approaches that states are embracing to calculate poverty rates in Community Eligibility Schools instead of the FRL proxy. Each has strengths and weaknesses:
Identified Student Percentage x 1.6: Using already available data, districts multiply their percentage of identified students by 1.6, a standard established in the federal Healthy, Hunger-Free Kids Act of 2010. This is an imperfect measure, because it is an approximation and not identical to the previous percentage of students approved for free and reduced-price lunch. Baltimore City Public Schools recently urged Maryland to use a 1.8 multiplier as a state commission considers a new education funding formula.
Most recent free and reduced-price school meals data: By using the most recent FRL eligibility data available before adopting the Community Eligibility standard, school districts have no immediate need for further data collection. But over time, as incomes and enrollment shift, the information becomes less reliable.
Data from other means-tested programs/sources: Data from programs such as SNAP, TANF, Medicaid or Head Start are readily available and subject to rigorous accountability controls, making it a viable approach. But this method could miss low-income children whose families don’t or can’t enroll in such programs. The could become a particular problem if new federal “public charge” regulations prompt immigrant families to avoid seeking federal benefits, even when their children are eligible.
Collect alternative income forms every 4 school years: Every four years, districts use household income surveys combined with available direct certification data to determine which children qualify as low-income. This method, while providing accurate information, depends on parents submitting detailed financial information. That could be a collection challenge. And the four-year window would make it harder to reflect shifts in income and enrollment.
Collect alternative income forms annually: Similar to the previous method, but done annually instead of every four years. This could be the most accurate approach, but would require soliciting detailed information from families every year, an even greater collection challenge.