
Table of Contents
Three years ago, Arizona became the first state to allow all students—regardless of income or need—to use public dollars for private school tuition and other educational expenses. The move marked a sweeping shift in the scale and scope of school choice in the United States.
The next school year, seven more states operated universal private school choice programs. By 2024-25, that number reached 10. And by the 2026–27 school year, at least 17 states are scheduled to run universal programs under Republican-sponsored legislation.1 By then, about half of the nation’s students will be eligible to receive public dollars to fund the elementary and secondary education of their choice.
At the same time, the tax bill that President Trump signed on July 4th included a federal tax-credit scholarship program that potentially provides private and parochial school scholarships to families nationwide, some of them with incomes estimated to be as high as $400,000 a year.
That’s a far cry from traditional private school choice programs that, beginning in 1990 in Milwaukee, provided public funds to low-income students or those in underperforming public schools to pay private school tuition, programs that are now available through vouchers, tuition tax credits, or education savings accounts (ESAs) in 35 states. While students in universal programs still represent a small share of the nation’s 49 million students, the speed and scale of the programs’ growth and potential for continued expansion raise important questions. Who are the programs serving? What schools are students attending? How much are the programs costing taxpayers? How are the programs affecting student achievement?
In response, FutureEd last year conducted an in-depth analysis of the eight states that operated universal or near-universal private school choice programs during the 2023–24 school year: Arizona, Arkansas, Florida, Iowa, Indiana, Ohio, Oklahoma, and West Virginia. For all but Arizona (and West Virginia, which launched mid-year in January 2023) this marked the first year of implementation.
We found that roughly 584,000 students participated across the eight states at a total cost to taxpayers of about $4 billion.2 Participation and spending varied based on how states defined eligibility, what expenses they allowed, and whether they capped enrollment or prioritized certain applicants. Contrary to many lawmakers’ expectations, most participants were already in private schools. As a result, public school enrollment didn’t immediately decline, but state budgets were strained in ways many legislatures had not anticipated. At the same time, equity concerns grew, as participation often skewed toward higher-income, predominantly white families. Oversight remained limited, with few states requiring robust academic reporting or quality controls for providers.
To see if these trends held or new ones emerged, we analyzed the results of universal choice programs in the 2024-25 school year—the second or third for Arizona and the other early adopters and the first for North Carolina and Utah.
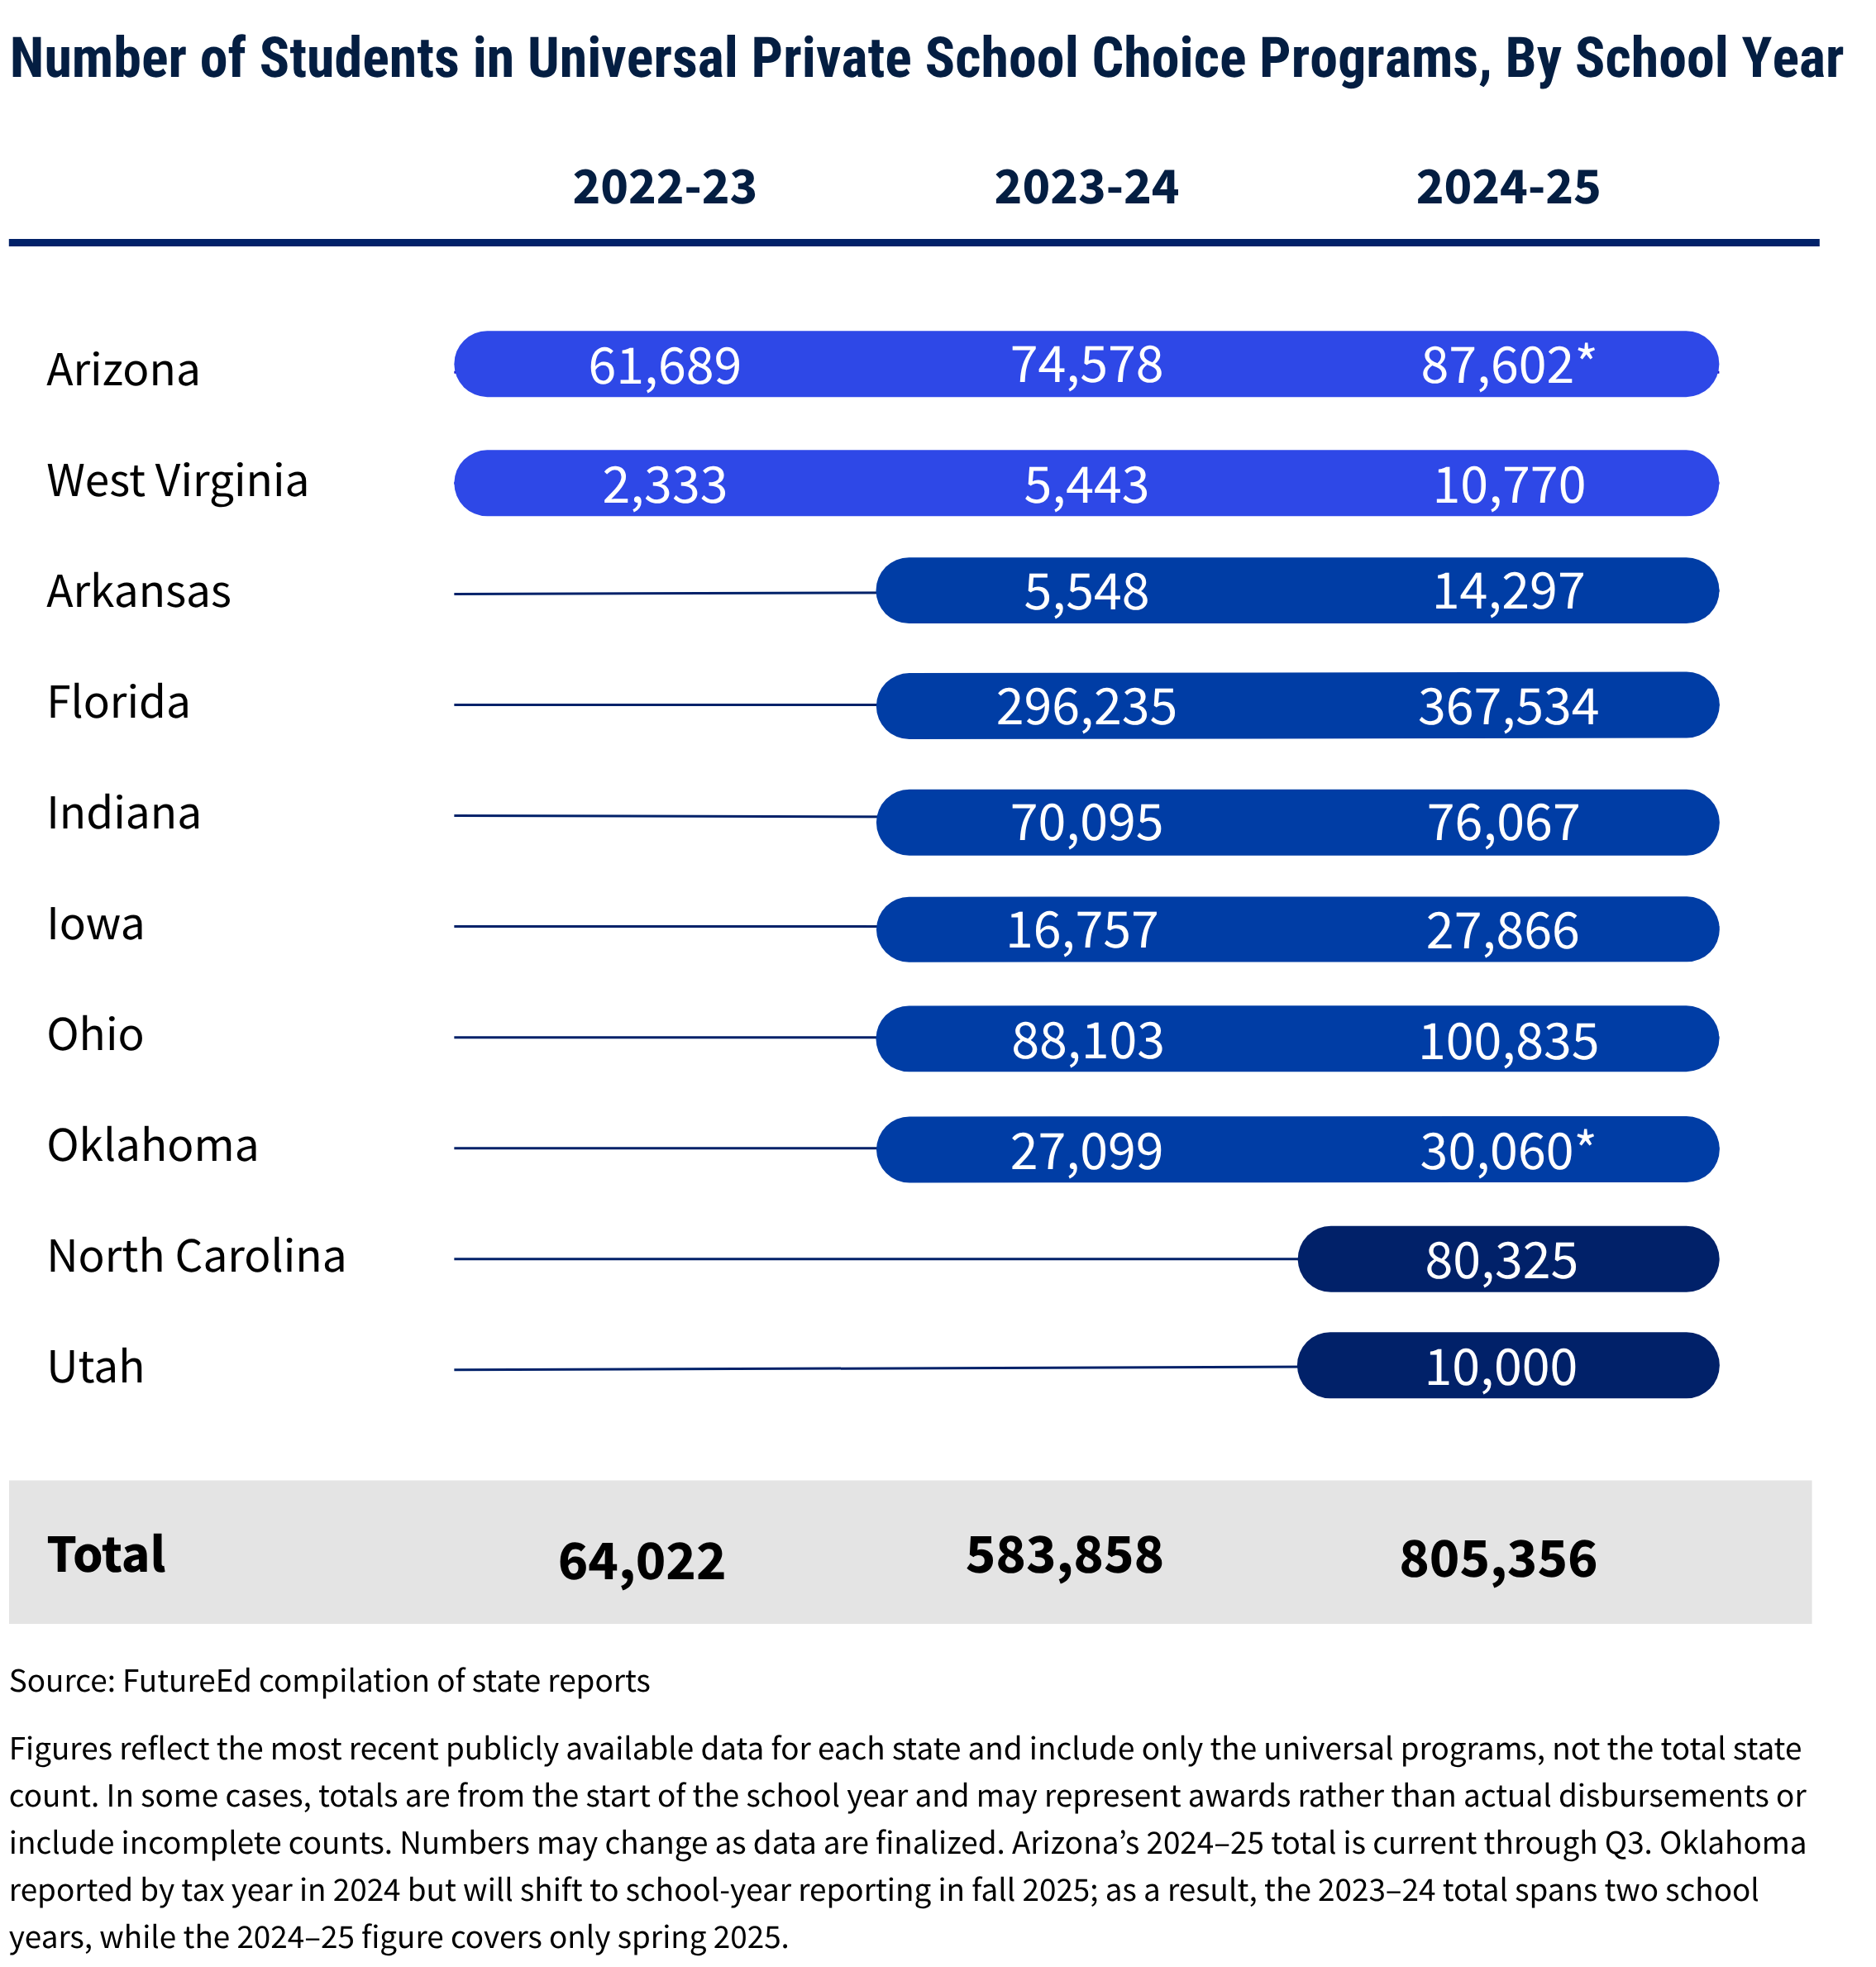 In addition to Utah and North Carolina’s new initiatives, several states expanded enrollment or lifted budget caps, either as planned steps toward fully universal programs or in response to growing demand. As a result, the number of students using universal choice programs grew nearly 40 percent from the previous year, to more than 805,000, and the price tag increased to $5.75 billion.
Year-to-year retention rates, we found, were generally high. That could point to strong parent satisfaction or reflect the fact that most participants continued to be students who were already in private schools (though we found more students moving from public schools than in the previous year).
A wider range of schools and other providers participated in the universal programs, our research revealed, but in Florida and elsewhere, many of the most selective schools declined to take ESA or voucher funds as payment. It’s unclear at this stage in the evolution of universal choice what the demand will be among families outside the private school sector and if supply would increase to meet rising demand, especially in rural areas, where there are many fewer private and parochial schools than in cities and suburbs. And it’s difficult to predict the quality of an increasing supply of private providers.
Several states made changes to their programs in response to questionable expenditures by ESA recipients, difficulty processing a large volume of reimbursement requests, and other challenges. They tightened expense eligibility, adjusted award amounts, contracted with new vendors, or improved administrative systems. At the same time, it remained difficult to gauge student outcomes under the choice programs in the continued absence of meaningful transparency requirements in many of the states.
FutureEd’s analysis of universal private school choice programs in 2024-25, detailed below, points to the substantial tension between advocates’ goal of expanding families’ private options and the nation’s history of spending public monies primarily on public schools, school reformers’ commitment in recent decades to improving educational opportunities for the nation’s neediest students, and demands for accountability in public spending.
Student Demographics
The demographic patterns of students participating in the programs in the first year of universal choice programs have largely persisted, with participation continuing to skew toward more affluent and white families.
In Indiana, the number of students from families earning over $150,000 more than tripled in 2023-24, when the state expanded eligibility by raising the income cap from 300 percent to 400 percent of the threshold for free and reduced-price lunch (roughly from $154,000 to $222,000 for a family of four). Participation among those earning above $200,000 grew more than tenfold. In the second year of the program’s expansion, 2024-25, participation again grew fastest among the highest income tiers, with nearly 8 percent of voucher families now earning more than $200,000. (See chart.)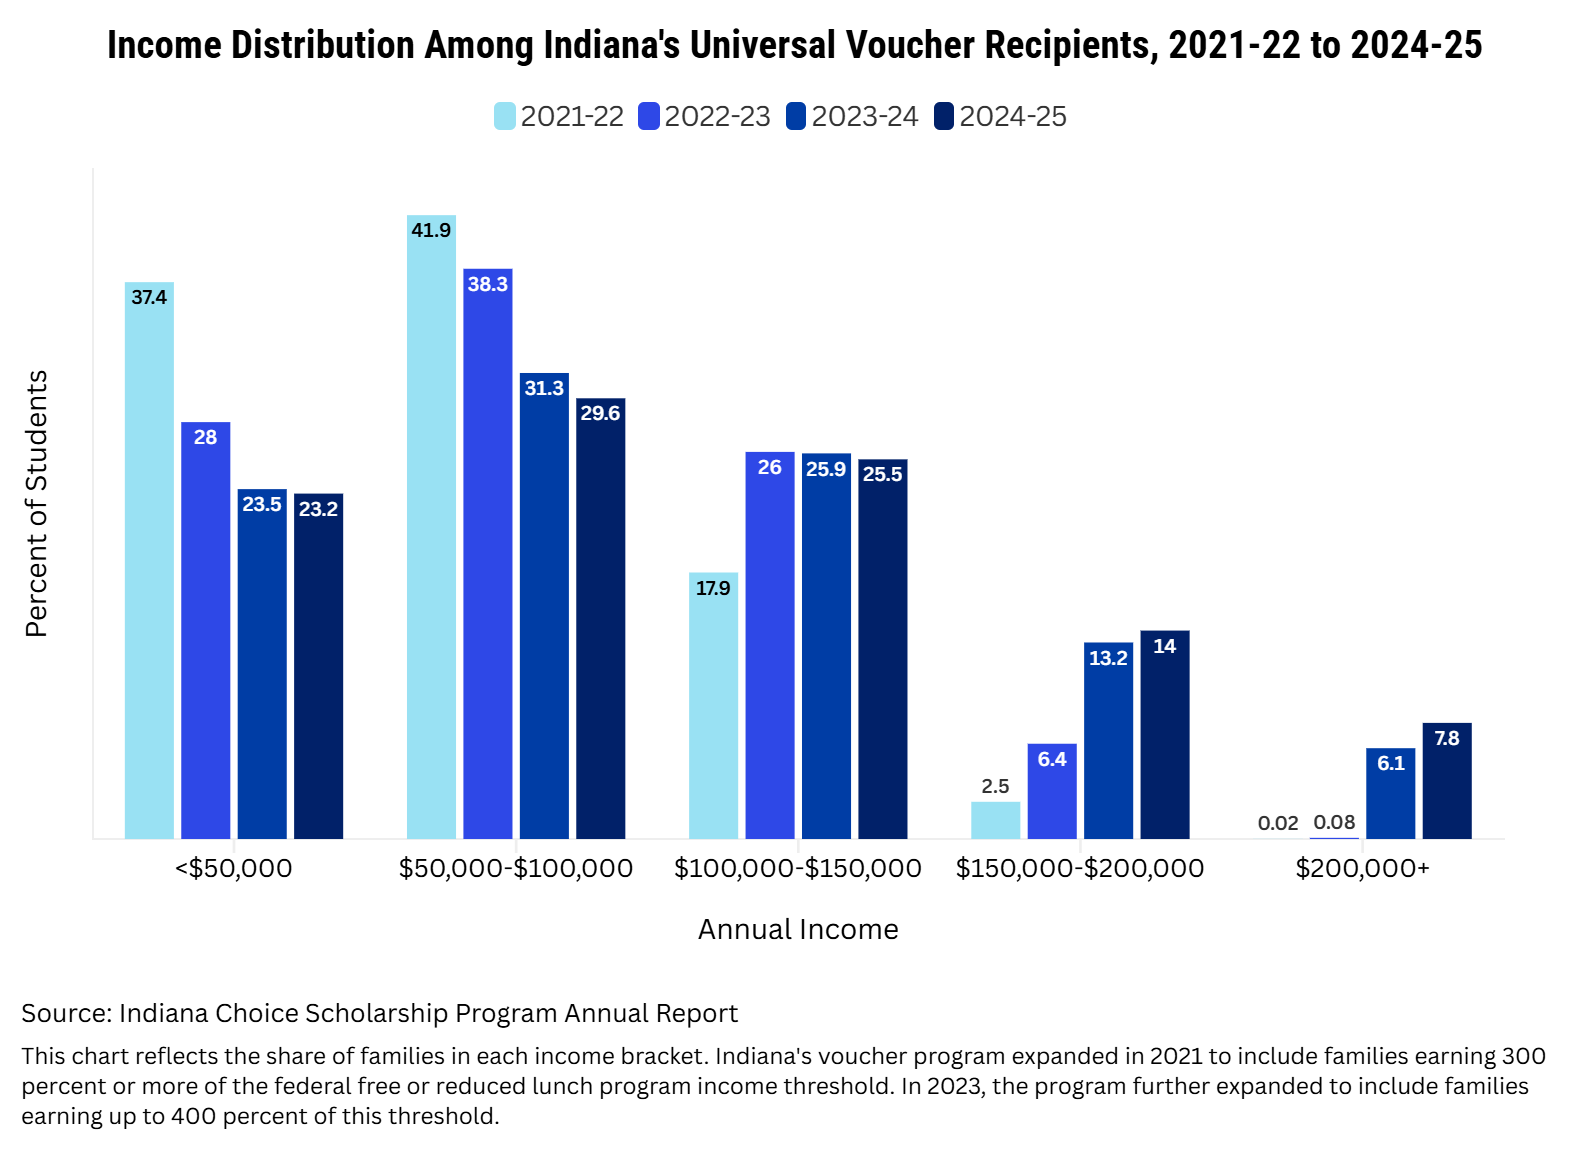
In North Carolina, which also expanded a program that previously only supported students from families below 175 percent of the federal poverty level (about $90,000 for a family of four), about 30 percent of 2024–25 recipients came from families earning under $58,000 for a family of four. About 42 percent had incomes above $115,000, with 14 percent above $260,000. While the wealthiest participants still represent a minority, they are overrepresented: only about 7 percent of North Carolina families earn more than $250,000.
The trends were similar in newly launched universal programs. In Oklahoma, which debuted a fully universal program in 2023-24, a quarter of the second-year choice participants came from households earning less than $75,000 or received public assistance.3 But another 25 percent were in families earning more than $250,000, a group that comprises only about 5 percent of Oklahoma households. These figures remained largely unchanged from year one.
At the same time, many high-priced private schools that attract wealthy families have opted out of choice programs, either to avoid oversight or because public dollars don’t come close to covering their tuition. As a result, families at the schools can’t use the public funding. “The super elite, super wealthy that are sending their kids to a $30,000-a-year school—a lot of their schools just aren’t taking [ESA funds],” explained Travis Pillow, senior director of thought leadership and growth at Step Up for Students, the non-profit organization that manages Florida’s ESA program. Instead, program growth is being driven by middle- and upper-middle-income families, those who may have been sacrificing to afford tuition and are now receiving public support for the first time. “If we’re looking at where the new uptake is, it’s people who are just above that 400 percent of poverty range,” Pillow added, such as a family of four earning $120,000. “Private school tuition is still not an easy fit in their household budget, but now they’ve got a little more financial wiggle room.”
And some states have designed their programs to limit participation among higher-income families when resources are limited. Utah prioritizes applicants based on need, resulting in a much higher share of recipients from low-income households, despite the program being universal. Ohio and Oklahoma scale award amounts by income to ensure that families with the fewest resources receive the most support. Oklahoma, for example, awards $7,500 to lower-income families and $5,000 to higher-income families.
Racial disparities also persisted into year two. In Ohio, white students accounted for 66 percent of EdChoice Expansion recipients prior to universal eligibility. That share rose to 82 percent in the first year of expansion, as almost all new students entering were white. And it remained at that level in year two.4 The trend in North Carolina is similar: prior to expansion, recipients were 63 percent white, 19 percent Black, and 15 percent Hispanic. In the first year of universal eligibility, white participation rose to 73 percent, while Black and Hispanic shares dropped to 11 percent and 10 percent, respectively. By comparison, 42 percent of North Carolina’s public school students are white, while 24 percent are Black and 23 percent are Hispanic.
Participation is more demographically diverse in Florida. Though the state saw more white, affluent families take part in its ESA program following the advent of universal eligibility, 42 percent of recipients identified as white in 2024-25, 36 percent as Hispanic, and 19 percent as Black—figures that more closely reflect the state’s public-school population than do the racial participation rates in Ohio and North Carolina. This could be attributed in part to Florida’s long history of private school choice, which began with initiatives for low-income families that spawned a network of private and Catholic schools serving economically and racially diverse communities.
Students’ Prior Enrollment
A defining pattern in the first year of universal implementation was the predominance of students already enrolled in private schools before receiving public funds. While this ran counter to some lawmakers’ expectations, it was not entirely surprising: families already paying tuition had a strong incentive to apply, while participation among public school students was constrained by private school capacity, admissions requirements, and the logistical hurdles of switching schools.
But would enrollment trends shift as the programs mature? Are more students leaving public schools? Are families opting into private education earlier or never enrolling in public school in the first place? And are public dollars expanding access for those previously priced out, or simply subsidizing those who would have enrolled in private schools anyway?
There was some evidence of greater participation by former public-school students in the programs’ second and third years, but trends varied across states.
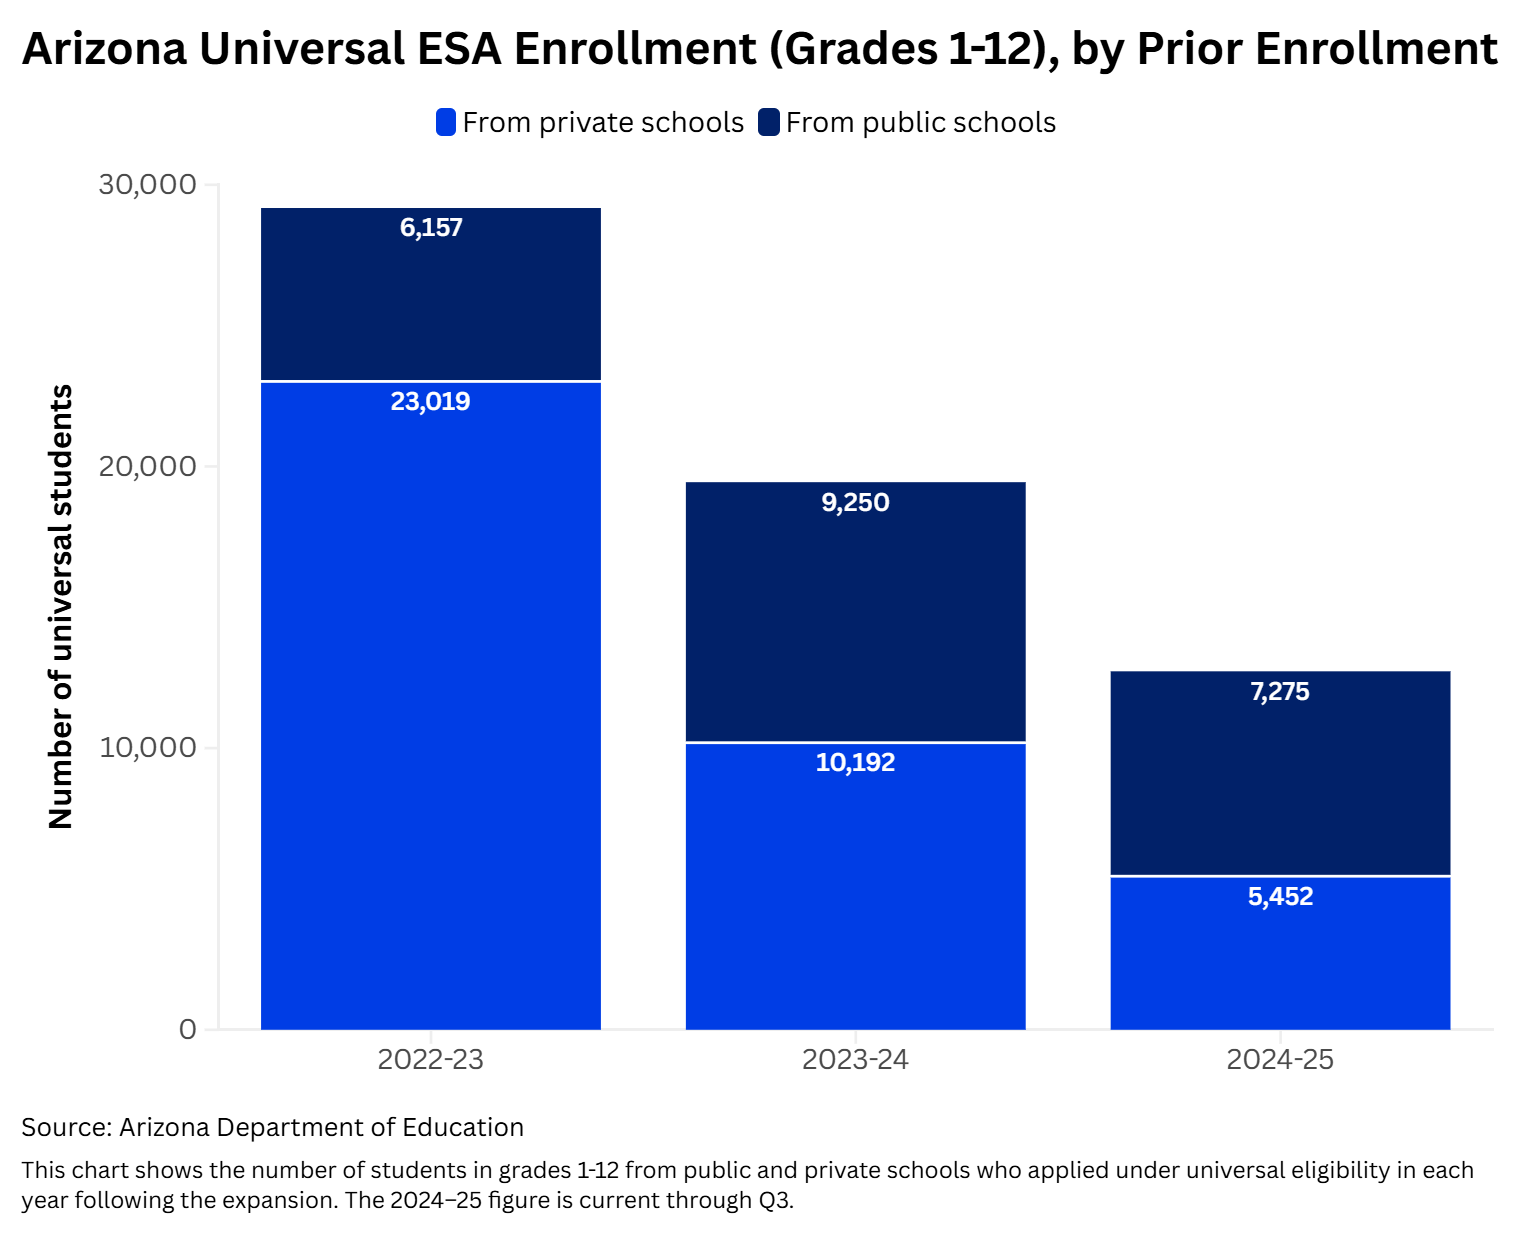 In the first year of Arizona’s program, 2022-23, just 20 percent of the new, universal ESA students in grades 1–12 (about 6,000 students) had previously attended public schools. That figure rose to more than 9,000 in year two, representing nearly half of new students. By the program’s third year, the 2024-25 school year, public school switchers made up 57 percent of new participants. (see chart) The growth in switchers may reflect a combination of factors: growing awareness of the program, the gradual expansion of private school capacity to serve more students, including new schools opening or existing ones scaling up, and the reality that some families needed time to weigh their options, secure admission, and make the decision to leave the public system.
Arkansas and Iowa showed more limited growth, though both states imposed eligibility restrictions that likely shaped participation. (Arkansas limited participation to students with disabilities, those from military, first responders and law enforcement families, and students zoned to D- or F-rated public schools, with an overall cap on the number of students. Iowa restricted eligibility to students previously enrolled in public schools or entering kindergarten, and applied income limits for those already attending private schools.) In Arkansas, roughly 17 percent of the new, year-two participants came from public schools, nearly identical to year one. As eligibility expanded to include homeschoolers, their share rose to 25 percent of the new participants, while the share from private schools dropped from over half to 38 percent. Iowa also saw little change. While exact numbers are unavailable due to missing retention data, our estimates suggest the share of new participants from public schools remained close to the year-one level of 13 percent and did not exceed 17 percent.5
It’s possible that states like Arkansas and Iowa will follow Arizona’s trajectory as they reach full universal eligibility, with more students coming from public schools. But that growth will depend on both demand among public school families and the private sector’s ability to accommodate them. Neither is well-documented at this stage, but data from Iowa’s first year is noteworthy: about 40 percent of approved applicants in 2023-24 planned to switch from public to private schools, but most did not ultimately enroll, pointing to early interest but also possible barriers related to private school capacity or admissions. (No applicant data has been released for the 2024-25 school year.)
Longer term, the percentage of new participants coming from public schools is inevitably likely to grow as students already in private schools graduate. The question is whether universal programs are changing family decisions or simply subsidizing choices they would have made regardless. If interest continues to grow among families outside the private sector, it will raise important questions about private school capacity, what’s driving families to leave the public system, and the impact of the departures on public schools.
Retention and Satisfaction
Retention rates—both within choice programs and at individual schools—offer an early indicator of parent and student satisfaction. High retention suggests families are finding value in their chosen schools, while lower rates may point to mismatches in expectations, low school quality, or other challenges.
Early data from several states show generally high retention rates. In Utah, more than 90 percent of ESA students continued to take part in the program in its second year. Arkansas reported similar results, with 90 percent of year-one participants continuing. Arkansas is currently the only state to publish school-level retention data and conduct a formal parent satisfaction survey. On a five-point scale, parents rated their overall experience with the ESA program at 4.11, indicating general approval.
Still, retention varied significantly across individual schools in Arkansas. At Ozark Catholic Academy in Springdale, one of the state’s top catholic schools according to the independent school-rating organization Niche, only 31 percent of its 16 ESA students returned. Sherwood Christian Academy, a small micro-school where all 13 students used ESA funds, seven students left, and all seven exited the program entirely. First Lutheran School in Fort Smith retained fewer than half of its 55 ESA students, while Mount St. Mary Academy in Little Rock lost just over 30 percent of its 81 ESA students.
At the other end of the spectrum, 11 of Arkansas’s 97 participating private schools had 100 percent retention, and many others retained a large share of their ESA students. Pulaski Academy, a top ranked school by Niche, retained 84 percent of its 211 ESA students, while Shiloh Christian School, another high-ranking school, saw 92 percent of its 233 ESA students return.
The reasons families leave a school—or exit a program altogether—are not clear. States do not conduct exit surveys that would shed valuable light on parents’ perceptions of the choice programs and participating schools. Some may return to public schools, while others may transfer to private schools that do not accept ESA or voucher funds.
These patterns underscore the importance of making school-level information more transparent and accessible. Although school changes can be beneficial for students, frequent transitions are often disruptive, especially for students already facing academic or social challenges. As more families navigate the private market with public funds, access to clear, comparable information on school quality, performance, and fit is essential to helping them make informed choices.
Student Performance
While schools are typically judged by whether they lead to better academic results and longer-term student success, expanding private school choice is often seen as a valuable end in itself by advocates of the strategy. And so far, states haven’t established clear, consistent metrics for measuring the success of universal choice programs, whether that’s improved test scores, higher college completion rates, or stronger long-term employment outcomes.
Most choice programs don’t require private or homeschool participants to take state assessments, which limits the availability of comparable data. And since many participants in the first year of universal choice programs were already attending private schools, nothing about their schooling changed, making it difficult to isolate the impact of participation on their academic achievement. Outcomes for homeschoolers are even harder to track in any standardized way.
But there is some information on student performance emerging in some choice states.
Iowa stands out for requiring ESA recipients to take the federally mandated tests it gives annually to charter and traditional public-school students. In 2023–24, ESA students outperformed public-school peers across most tested grades in both reading and math. Among eighth graders, for example, about 78 percent of ESA students scored proficient or advanced in math, compared to 72 percent of their public-school peers. The gap was much wider among low-income students: 72 percent of ESA students eligible for free or reduced-price lunch were proficient in math, compared to 57 percent of their public-school counterparts.
But some two-thirds of ESA students were enrolled in private schools before receiving public funds, so their performance may reflect the quality of those schools—or the characteristics of the families who choose them—rather than the ESA program itself. Still, because students already attending private schools had to be under the ESA program’s income cap of 300 percent of the federal poverty level (approximately $96,500 for a family of four), most tested students came from low- or moderate-income households. That those students, particularly those eligible for free or reduced-price lunch, outperformed their public-school peers suggests the schools rather than differences in family resources may be contributing meaningfully to student success. If this is true, it points to the potential value of expanding access to more students.
Ohio also reports academic results for three of its five voucher programs (excluding those for students with disabilities), but it does not breakout information specifically for the universal EdChoice Expansion program. It reports proficiency rates on the state’s standardized tests broken down by how long students have been in the program—one year, two years, or more than three. Prior to the state making all students eligible for private school choice in fall 2023, proficiency rates among students with one year in the program were largely similar to those with two or three years, suggesting that longer time in the program wasn’t necessarily associated with better outcomes and likely reflecting differences in school quality. School-level results show wide variation. At St. Adalbert School in Cuyahoga County, for example, fewer than 2 percent of 179 students in the voucher program for at least three years were proficient in math. By contrast, several schools posted 100 percent proficiency rates.
And past research on Ohio’s voucher programs found that students who leave public schools do not perform any better than those who stay, and may in fact perform worse. But a 2025 study by the Urban Institute found that voucher students were significantly more likely to enroll in college, especially four-year institutions (45 percent vs. 30 percent) and selective colleges (29 percent vs. 19 percent), suggesting that test scores may not fully capture program impacts, particularly when curricula differ between public and private schools.
After Ohio’s move to universal ESA eligibility, there was a noticeable bump in performance in 2023-24 among new program participants, with proficiency rates averaging about 75 percent—higher than that of any previous cohort. But this likely reflects a demographic shift rather than academic growth; many of the newly eligible students were more affluent and already enrolled in private schools.6
Some states require testing but not their statewide assessments, resulting in a menagerie of measures that can’t be easily compared. In Arkansas, for example, there is no uniform testing requirement. ESA students who took tests with national percentile rankings scored around the 50th percentile in both reading and math in 2023-24, the program’s first year. But without universal participation in the assessments, public-school benchmarks, or measures of students’ annual growth on assessments, the results offer little insight.
Research dating to the origin of private school choice programs in the 1990s is mixed. Early studies of smaller-scale programs showed promising effects on student achievement, but more recent evaluations of statewide programs have generally found that students who leave public schools to attend private schools with public funding typically do not outperform those who remain. Without stronger assessment and reporting requirements, it will remain difficult for both policymakers and parents to assess whether the new generation of universal choice programs are delivering better academic outcomes than the more targeted private school choice programs that preceded them. Also, ESA funds can be used for a wide range of expenses beyond tuition, making it harder to assess whether they’re delivering educational value.
Test scores are only one measure of school quality and accountability; other outcomes like students’ sense of safety and belonging also matter for long-term outcomes. As states and school districts incorporate broader measures of school quality into their public accountability systems—such as chronic absenteeism, school climate, and college and career readiness—private schools receiving public funding could do the same.
School Participation, Capacity, and Quality
The number of private school providers grew in 2024-25 as the number of students participating expanded in what was the second year of most of the universal choice programs. The growth in supply raises key questions: What kinds of schools are participating? Can the private-provider sector continue to expand? And how are states ensuring quality as the market evolves?
In Arkansas, where providers must be accredited, the number of schools in the state’s education savings account program grew from 97 to 128. Most new entrants were existing schools that maybe waited to see how the program unfolded before joining. At least one, Wisdom and Truth Academy in Bentonville, was newly established for the 2024–25 school year. For schools operating less than a year, the school must demonstrate financial stability by either providing a CPA letter verifying sufficient capital or submitting a surety bond or letter of credit to the department covering one quarter’s anticipated funding.
Geographic reach also expanded. In Iowa, 64 of the state’s 325 school districts had no ESA students in year one; that number dropped to 44 in year two, with all the newly participating districts located in rural areas.7 Still, most ESA students and schools remain located in urban and suburban communities in universal choice states.
States also saw a diversification in provider types. In Florida, for example, about a dozen public school districts signed on as part-time providers for homeschoolers in year two, up from none in year one. Utah has a handful of districts doing the same. Arkansas in 2024-25 began allowing homeschooling families to participate in its ESA programs. That expanded the market for tutoring companies and other education service providers and subsequently increased the number of approved ESA providers from four to more than 400.
Whether the private sector can meet the demand for ESA-funded services depends on three supply levers: existing schools opting in, current providers expanding capacity, or new schools opening. Existing schools, particularly the higher-performing ones, are likely already at or near capacity and may only be able to grow incrementally, most likely by expanding incoming kindergarten classes or other natural entry points—thereby limiting the number of new seats in such schools. Top schools’ selective admissions policies also eliminate them as options for many students.
At the same time, launching new schools requires start-up capital, sufficient enrollment, and the ability to manage the regulatory and financial risks that come with opening new schools.
Yet advocates say they’re confident that the private education market will adjust to meet demand, and there are early signs of accelerated school creation in some universal choice states. Iowa, for instance, saw just two new private schools open the year before ESA implementation. That jumped to 11 in 2023 (year one) and 24 in 2024 (year two). Not all new schools may immediately accept ESA funds, but the growth suggests the program is spurring supply.
In Florida, where many traditional private schools are at or near capacity, growth is coming from microschools—small, often home-based programs that are easier to start and more flexible to run. “The private schools are becoming saturated,” noted Travis Pillow from Step Up. “A lot of the new supply and new growth is in that unbundled space where people are doing micro schools, people are doing homeschool co-ops, these types of more unconventional learning environments. They’re way easier to start. They’re cheaper to start. They’re smaller.” But their limited size, typically serving under two dozen, means they alone cannot meet statewide demand. “You’re going to need a lot of those to really move the needle in a state of more than three and a half million kids,” Pillow said.
In Utah, where the ESA program primarily serves homeschooled students, the supply of seats is increasing largely through nontraditional and homeschooling providers as well.
Overall, the current provider mix is wide-ranging, with everything from small, family-run operations to religious schools and elite prep academies. In some states, religious schools dominate the landscape. In Florida, for instance, about 60 percent of ESA schools are religious and they enroll a disproportionate share of ESA students. Catholic schools remain dominant, but there has been recent growth among Jewish and non-religious providers. “It’s still predominantly religious, but the secular slice of the pie has been getting bigger,” Pillow told me. In Iowa, roughly 60 percent of ESA participants attend Catholic schools.
Many of the most expensive private schools opt out of ESA programs to avoid the hassle of administering awards that don’t cover their tuitions, and because they wish to avoid state oversight or maintain their exclusivity, Pillow and others say. In Florida, about one-quarter of private schools don’t participate, many of them high-cost institutions. Ohio shows a similar pattern, where accountability requirements discourage some elite schools from joining, state officials told us. Ohio’s participating schools must follow the same rules as public schools.
There are exceptions. In Arkansas, top-tier private schools like Pulaski Academy, where tuition reaches nearly $20,000, are participating. Pulaski’s ESA participation grew from 211 students out of a student body of 1,200 in year one to 391 in year two, when the state limited participation to students with disabilities, zoned to a poor performing public school, or those from military or first responder families. With eligibility restrictions lifting in 2025-26, all 1,200 Pulaski families will be eligible to apply.
Other elite Arkansas schools participating include The Thaden School, which charges nearly $30,000 per year and joined in 2024–25 with about 70 ESA students. Subiaco Academy, a boarding school, also accepts ESA funds. In North Carolina, about half of the state’s top 25 private schools, as rated by Niche, participate.
ESAs and vouchers can make Pulaski and other elite schools attainable for some moderate-income families whose students meet the schools’ admissions standards, even if the cost remains out of reach for many others. But the question for policymakers is whether it’s prudent to spend public funds to subsidize the tuition of wealthy students under universal choice programs to achieve that goal.
As the provider landscape expands, so does the need for quality assurance. Oversight varies widely by state. Some, like Iowa, require schools to be accredited, providing a baseline of accountability. Others do not. And accreditation does not guarantee academic quality or strong outcomes. Louisiana, which will launch its program in the fall, is the only state that plans to revoke voucher eligibility from private schools when students consistently perform poorly on standardized tests.
School choice advocates often argue that parental decision-making is the best form of accountability because families will leave schools that are poor-performing or a poor fit for their children. But that argument assumes families have meaningful school options and access to reliable information about school quality. As public dollars increasingly flow to private providers, states face an important question: Do they have a responsibility to ensure those providers meet minimum quality standards and that public funds are directed to educational settings that produce positive student outcomes?
Finance and Administration
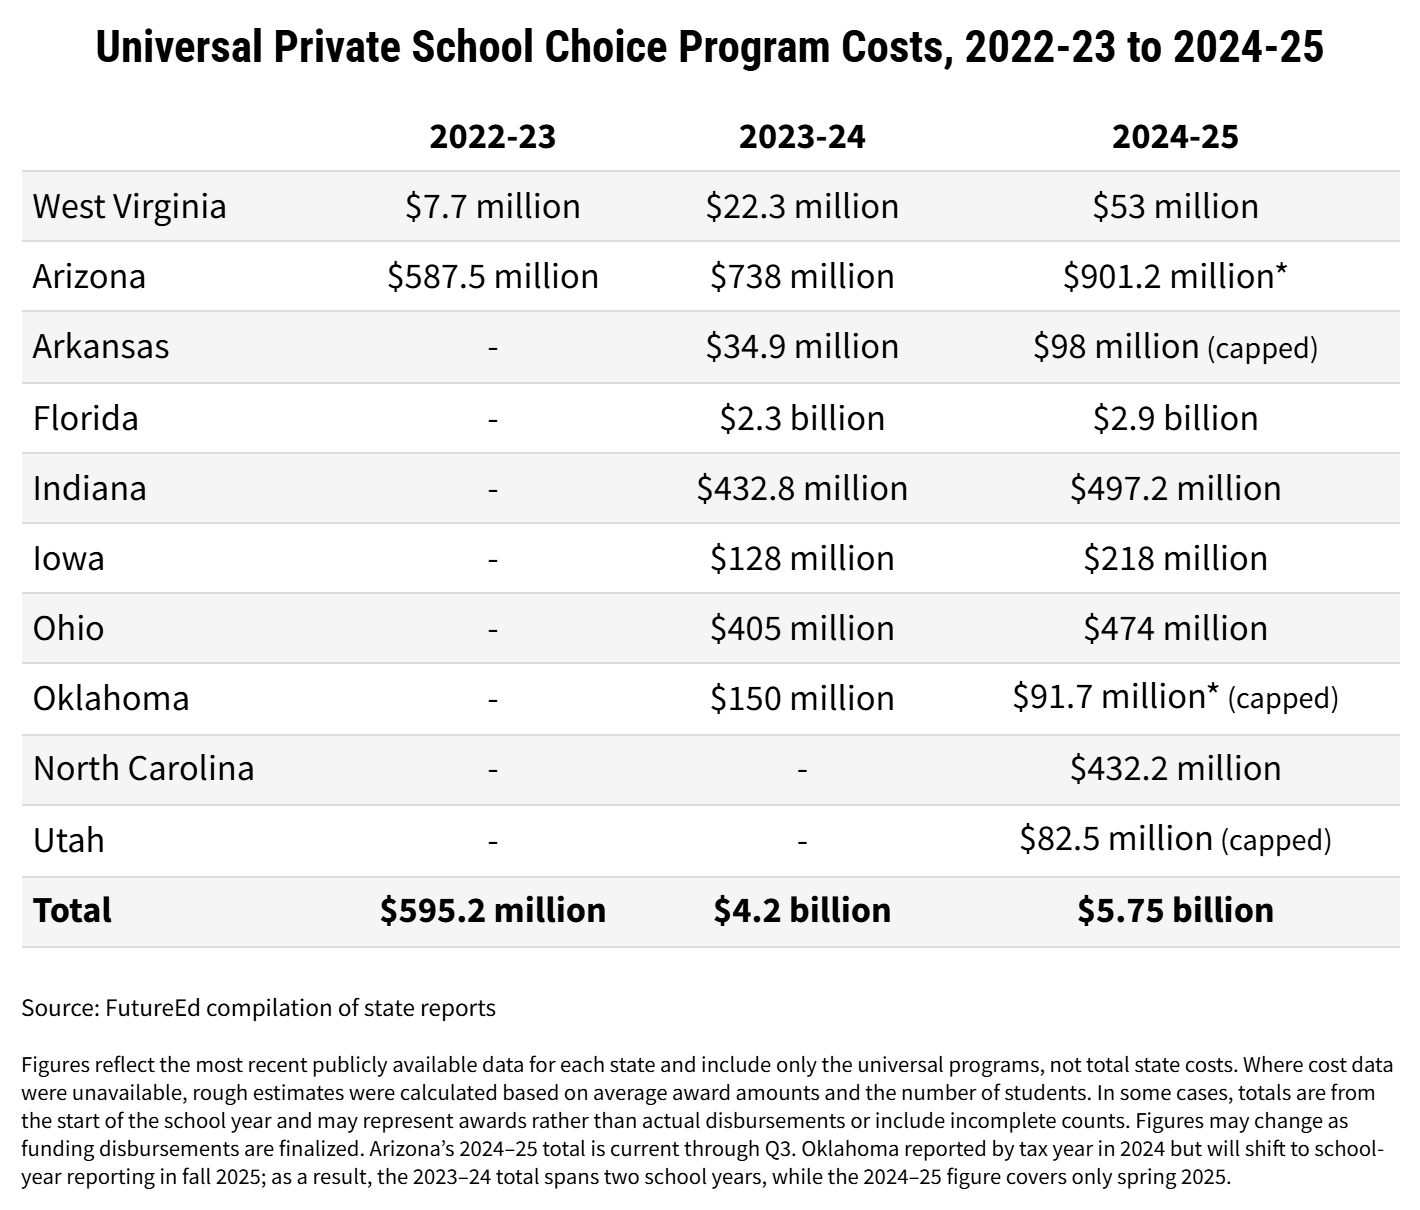
Universal private school choice programs are quickly becoming a major public expenditure. The 10 states operating such programs in 2024–25 spent a combined $5.75 billion on them, up from about $4 billion the previous year. In several states, particularly those phasing in eligibility, spending more than doubled in one year. But beyond the rising price tag, fundamental questions remain: How are families using these funds? Are public dollars being well spent? And how is the shift affecting public education?
Spending patterns vary widely depending on program design. Traditional voucher programs provide public funding for families to use exclusively on private school tuition. In some instance, vouchers monies have heavily subsidized private schools. In Indiana in 2023-24, 178 of the 349 private schools that accepted vouchers had more than 90 percent of their students using vouchers.
 ESA programs, by contrast, allow families to use funds for a broad range of educational expenses, including tutoring, instructional services, and curriculum, though tuition still typically makes up the largest share of spending. In Arizona, a state with some of the broadest allowable expenditures, tuition and fees has accounted for 51 percent of 2024-25 spending that has been reimbursed so far. But other spending is growing in the state: tutoring and teaching services rose from $16 million to $27 million, or 14 percent of the total spending, between 2023-24 and 2024-25.8
But not all spending has aligned with lawmakers’ intentions. In Utah, where 80 percent of ESA students are homeschooled, some families’ use of ESAs for extracurriculars such as dance lessons, pianos, and zoo or aquarium chaperone passes prompted legislative action to tighten spending rules. “In response to certain purchases identified during the first year of the program, lawmakers took action to better align spending with the scholarship’s core purpose: supporting a child’s education,” said Robyn Bagley, executive director of Utah Education Fits All, a non-profit advocacy “watchdog” for the ESA program. “The legislature determined that updates were needed to clarify allowable uses and safeguard the intent of the law.” While such purchases represented only a small share of overall spending, lawmakers’ response highlights the importance of clearly defining program parameters and maintaining strong oversight to identify misuse and make timely adjustments when needed.
For the 2025-26 school year, Utah lawmakers lowered award amounts for homeschoolers, capped extracurricular spending, restricted materials to coursework-related items, and barred spending on things like clothing and multiple chaperone passes. The state also switched program managers to improve both user experience and oversight. The program manager ultimately is responsible for approving expenses under the law.
Arkansas revised its program for 2025-26 to include “reasonable” costs for co-curricular courses in fine arts, music, and STEM, as well as transportation and extracurriculars, but placed limits on how much can be spent in each category.
Arizona, long criticized for lax oversight of its ESA program, was also considering tighter controls for 2025–26, including caps on spending on items like musical instruments ($4,000 every three years), laptops ($2,000 every two years), and home economics tools ($500 annually). It would have also banned large appliances, motorized vehicles, and amusement park tickets. State Superintendent Tom Horne proposed the regulations, seeking to take a more aggressive stance on spending oversight than his predecessor. Not surprisingly, perhaps, parents have pushed back, arguing the proposed limits are too restrictive. At state board meetings this spring, some said the caps wouldn’t cover essential supplies, including costume-making materials, baking tools, or $5,000 Apple computers for film production. Parents ultimately won, and the state board did not include the caps in its revised handbook. Meanwhile, there have been press accounts of Arizona families attempting to buy $24,000 golf simulators, $5,000 Rolexes, and $16,000 cellos. One case involved out-of-state individuals fraudulently claiming $110,000 for 50 nonexistent children. While such instances of fraud appear rare, they highlight the need for strong oversight mechanisms.
But oversight will only become more difficult as ESA programs scale. Arizona’s ESA reimbursement system was overwhelmed this year and shifted to a “pay now, check later” model as they became backlogged with reimbursement requests, automatically approving purchases under $2,000 and auditing afterward. Officials claimed that the shift was needed to pay families in a timely fashion. But it also increases the chances of inappropriate spending going unnoticed. As a measure of the increased administrative burden the expanding ESA programs are placing on states and program administrators more generally, Step Up for Students, the non-profit organization that manages Florida’s ESA program, struggled to distribute funds to families after Florida shifted to universal eligibility. “The growth forced us to move beyond our manual processes. We had to figure out how to automate and how to do things at scale. And that required us to evolve, to rethink a lot of aspects of how we do business,” Pillow said. The organization has since adjusted its operations by upgrading its technology and hiring new leaders with finance expertise to accelerate processing of applications, payments, reimbursements, and provider approvals, highlighting how even well-established systems can struggle to keep pace with rapid program growth. After the changes, the time it took Step Up to process a reimbursement decreased from 33 days to 4 days, even as the number of reimbursement transactions doubled to 2 million, Pillow said.
Impact on Public Schools
In the first year of universal implementation, most scholarship participants were already in private schools, so public charter and districts schools weren’t losing many students and thus much funding. That meant the financial burden of the universal choice programs fell largely on state budgets, which began funding students they hadn’t funded before. Most states give choice students a portion of what they give public schools per pupil (often around 90 percent). So, while a state may save money when students leave public schools, it incurs new costs when they fund choice students already in private schools. In Iowa, for example, the program cost $128 million in its first year, with about $85 million representing new spending for existing private school students.9
But as more families begin switching from public to private schools, as is happening in Arizona, where more than half of new ESA participants came from public schools in 2024-25, the fiscal dynamics shift. States may save money if ESA awards are lower than the per-pupil funding they provide public schools. But districts lose enrollment-based funding over time. Because most state formulas are based on prior-year enrollment, these losses are delayed, but can still create serious pressure on local school districts and charters, especially those already facing declining enrollment. Some states have put provisions in place to cushion that impact. Iowa, for example, provides a $1,200 payment for every public-school student who leaves. But many have not.
The impact of these shifting dynamics will vary across districts, depending on how many students they’re losing and how heavily they rely on state funding. In Arizona, some districts are seeing accelerated enrollment losses to the private sector. Mesa Unified, the state’s largest district, has lost 1,600 students to the ESA program since 2017—400 in the last year alone. Gilbert Unified has lost more than 700 students over the same period, nearly 200 of them in the last year.
Critics argue that public funds should be used to strengthen the public education system rather than subsidize the private educations of students under universal choice, even if the funds aren’t coming directly out of public-school budgets. The tension inherent in universal private school choice programs is increasingly visible in state budget debates. In Louisiana, for example, lawmakers proposed cutting the $30 million for a statewide tutoring initiative to help finance teacher raises—while leaving $100 million earmarked for private school vouchers untouched.
A few school districts in Florida, Arizona and Utah have responded to the threats to their funding by participating in ESA programs themselves. By offering part-time classes, extracurriculars, or other services eligible for ESA reimbursement, districts can generate new revenue and remain connected to families exploring alternative models. In Arizona, for example, roughly $2 million in ESA spending went back to public schools as families used their funds on district-run offerings.
What Comes Next
The universal private school choice movement is expanding rapidly as it enters its fourth year in 2025-26. More states are launching programs, existing programs are lifting enrollment caps and eligibility restrictions, budgets are growing, and the policy footprint is expanding in ways that would have seemed unlikely just a few years ago.
Arkansas and Iowa will have completed their transitions to full universal eligibility, and Indiana, home to one of the nation’s oldest school voucher programs, will offer full universal access for the first time. Alabama, Louisiana, Tennessee, Idaho, New Hampshire, and Wyoming are also preparing to launch or expand programs. West Virginia, which already operates a nearly universal ESA, is expected to open access to all students in 2026-27. And after years of failed attempts, Texas is also set to launch a universal program that year.
But if the programs’ costs rise too quickly and funding falls short, states may need to scale back award amounts, introduce income-based scaling like Ohio’s, or otherwise prioritize which students receive funding, if they don’t already do so. Others might choose to raise budget caps to accommodate more students, though doing so could further stretch state resources.
Also worth watching is whether states follow the lead of Utah and Arkansas and introduce restrictions on eligible expenses and spending limits on things like extracurriculars to ensure dollars are used responsibly.
The absence of information about student achievement and school performance, and the newness of the universal choice programs make it difficult to know whether they are or will be effective in promoting student success. Some advocates are wary of imposing testing requirements, viewing choice itself as the goal. But without better data and clearer expectations for success, policymakers can’t evaluate impact, and families can’t make fully informed decisions. Cases of attempted fraud in Arizona and spending on items of questionable educational value in Utah highlight the need for stronger oversight over how tax dollars are used, but the sheer volume of transactions can make that challenging. And the wide range of allowable expenses under many ESA programs further complicates efforts to measure educational value.
No less challenging are the questions of fairness and fiscal responsibility in using scarce public resources on affluent families. While raising income caps expands access to middle-income families who are maybe too wealthy for traditional aid but still can’t afford many private schools, having no cap at all, or at least no funding prioritization or scaling of awards based on need, is harder to defend. Proponents argue that broad eligibility helps build political support, but states will need to decide whether that’s the best use of limited public funds.
As universal private school choice programs expand, the responsible question to ask is how they can be structured to best serve both students and taxpayers—how they can be best designed to deliver educational value and promote the broader goals of educational equity and social mobility. The challenge ahead, in other words, is to ensure that public funds—regardless of whether they’re spent in the public or private education sectors—advance the public interest.
[1] Montana also offers a universal tax-credit scholarship program, but due to its limited scale and small award amounts, it is not included in this analysis.
[2] The 2023–24 student total is higher than previously reported due to updated year-end figures, largely reflecting an undercount in Florida in last year’s publication.
[3] Oklahoma’s program started by tax-year, so year 1 reflects spring 2024 and fall 2024, spanning two school years. Year 2 only reflects spring 2025, as the program is shifting to school year starting in fall 2025.
[4] This applies to the universal program only. Ohio also operates other voucher programs, including one for students in low-performing public schools, that serve higher shares of students of color.
[5] For 2024–25, Iowa reported the number of new ESA participants who came directly from public schools but did not report the total number of new participants. If all students from the previous year returned, public school students would account for a maximum of 17 percent of new participants. If 90 percent returned, that share would fall to about 13 percent.
[6] Ohio previously required voucher students to take state standardized tests but now permits nationally normed assessments. While the state website still says results are comparable, its’s unclear how accurate that is or how many schools have switched tests.
[7] According to the National Center for Education Statistics classification
[8] Arizona’s 2024-25 number reflects spending through Q3.
[9] Based on the number of students already in private schools